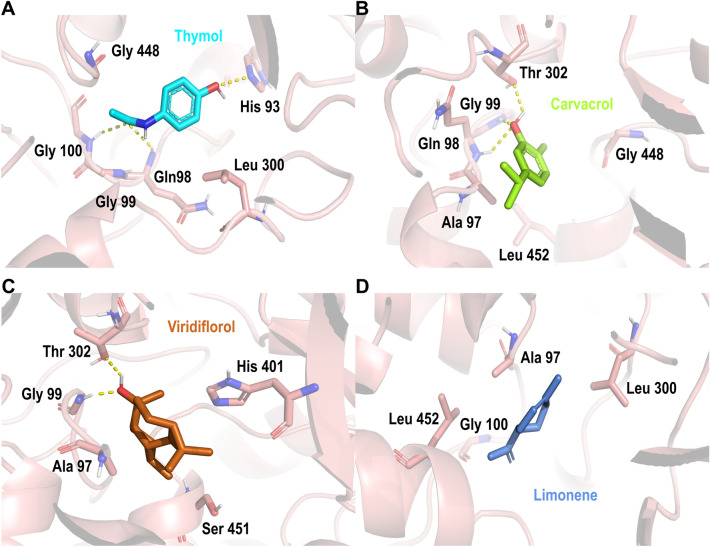
Figure 6.
Docking poses of Best ranked secondary metabolites on subunit A of mitochondrial complex II in A. aegypti. (A) thymol; (B) carvacrol; (C) viridiflorol; (D) limonene. Mitochondrial complex II’ residues are colored according to the atom type of the interacting amino-acid residues (protein’s carbon, salmon; oxygen, red; nitrogen, blue). The protein–ligand interactions are represented by dash lines as follows: hydrogen bond interactions are colored in yellow.

