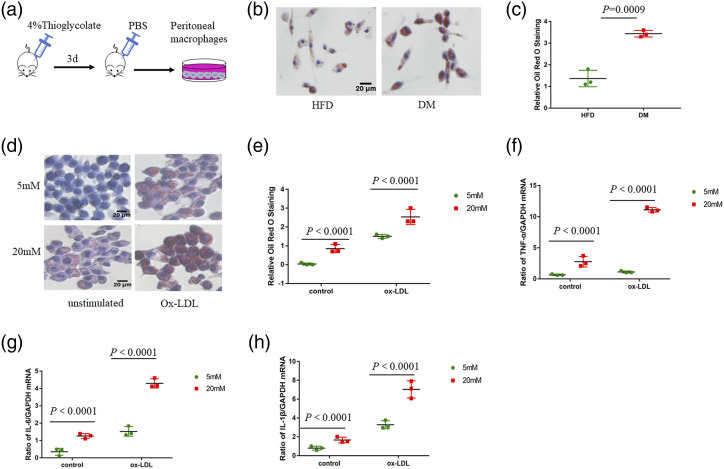
Figure 2.
High glucose induces macrophage proinflammatory activation and foam cell formation. (a) Peritoneal macrophages were isolated from ApoE−/− mice. (b–c) Oil Red O staining of Peritoneal macrophages incubated with ox-LDL (50 μg/mL) for 24 h. Scale bar, 20 μm. (d–e) Oil Red O staining of RAW264.7 cultured with 5 mM glucose or 20 mM glucose and incubated with or without ox-LDL for a further 24 h. Scale bar, 20 μm. (f) Quantitative polymerase chain reaction was performed to detect the mRNA levels of TNF-α. Two-way ANOVA with Bonferroni post-hoc test (n = 3). (g) Quantitative polymerase chain reaction was performed to detect the mRNA levels of IL-6. Two-way ANOVA with Bonferroni post-hoc test (n = 3). (h) Quantitative polymerase chain reaction was performed to detect the mRNA levels of IL-1β. Two-way ANOVA with Bonferroni post-hoc test (n = 3).

