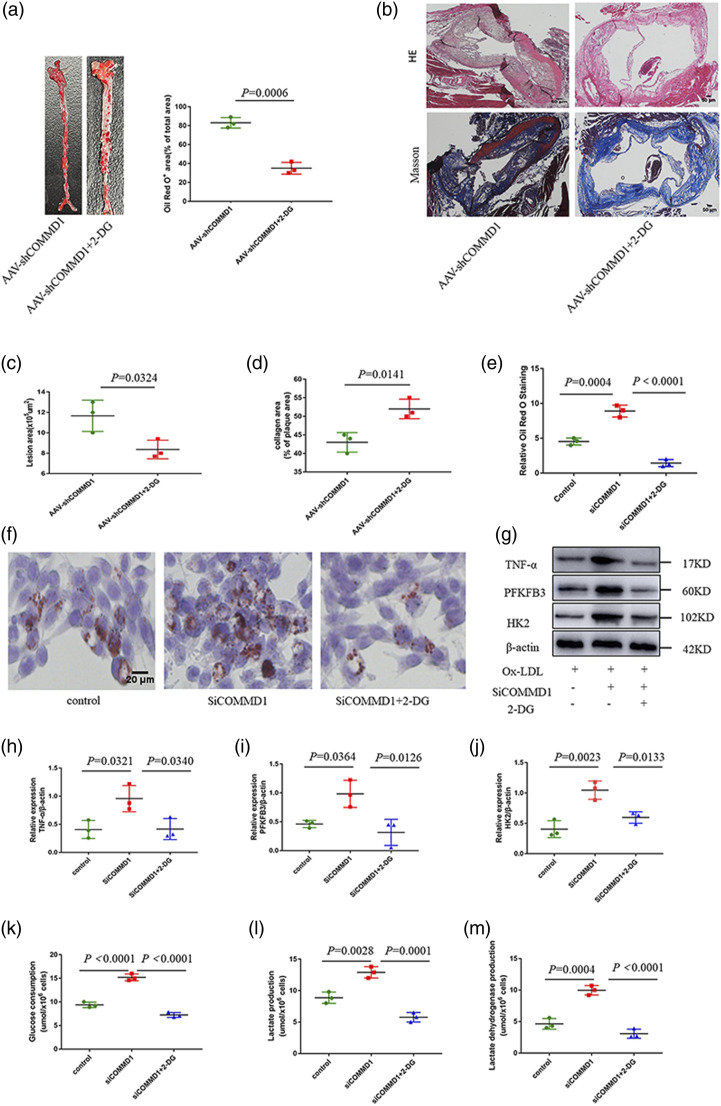
Figure 5.
Inhibition of glycolysis reduces COMMD1 deficiency-promoted atherosclerosis. (a) Oil Red O staining of aortas from glycolysis inhibitor administrated ApoE−/− mice in the presence of AAV-shCOMMD1 fed HFD for 24 weeks (n = 3). Data represent the percentage of plaque area/total vessel area. Unpaired two-tailed Student’s t-test. (b) H&E staining (the first row) and Masson staining (the second row) of representative aortic root sections (n = 3). Scale bar, 50 μm. (c) Quantitative analysis of the lesion area. Unpaired two-tailed Student’s t-test. (d) Quantitative analysis of plaque collagen area. Unpaired two-tailed Student’s t-test. (e–f) Oil Red O staining of RAW264.7 cells incubated with 2-DG for 0.5 h, and transfected with siCOMMD1 for 48 h in the presence of 20 mM glucose and ox-LDL. (g) Western blot analysis of TNF-α, PFKFB3, HK2, and β-actin expression at the protein level in RAW264.7. (h) Quantification of expression of inflammatory cytokines (TNF-α). Two-way ANOVA with Bonferroni post-hoc test (n = 3). (i) Quantification of expression of PFKFB3. Two-way ANOVA with Bonferroni post-hoc test (n = 3). (j) Quantification of expression of HK2. Two-way ANOVA with Bonferroni post-hoc test (n = 3). (k) Glucose consumption in RAW264.7. Two-way ANOVA with Bonferroni post-hoc test (n = 3). (l) Lactate production in RAW264.7. Two-way ANOVA with Bonferroni post-hoc test (n = 3). (m) lactate dehydrogenase production in RAW264.7. Two-way ANOVA with Bonferroni post-hoc test (n = 3).

