Figure 3.
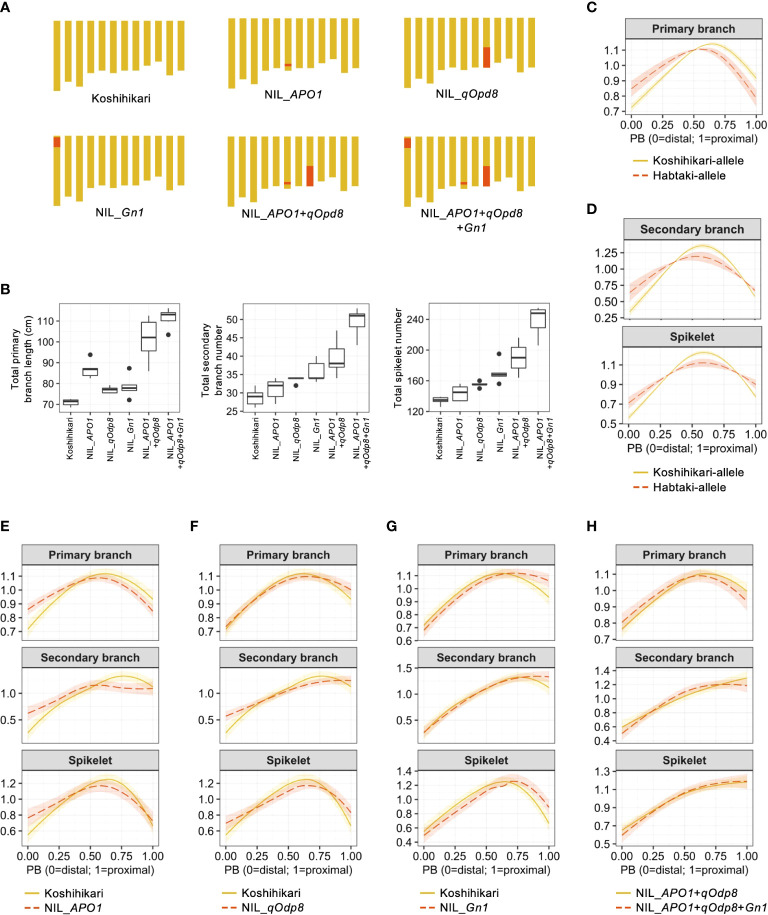
Confirmation of QTL effects using near-isogenic lines (NILs). (A) Graphical genotypes of NILs used in this study. Yellow and red areas indicate the genomic regions derived from Koshihikari and Habataki, respectively. (B) Boxplots of the phenotypic values of NILs. Box edges represent 0.25 and 0.75 quantiles with median values shown by bold lines. Whiskers extend to data no more than 1.5 times the interquartile range, and remaining data are indicated by dots. (C) Estimated effect of APO1 on the organ distribution pattern. (D) Estimated effects of qOdp8 on the organ distribution patterns. (E) Smoothing curves of organ distribution patterns for Koshihikari (yellow solid lines) and NIL_APO1 (red dashed lines). (F) Smoothing curves of organ distribution patterns for Koshihikari (yellow solid lines) and NIL_qOpd8 (red dashed lines). (G) Smoothing curves of organ distribution patterns for Koshihikari (yellow solid lines) and NIL_Gn1 (red dashed lines). (H) Smoothing curves of organ distribution patterns for NIL_APO1+qOpd8 (yellow solid lines) and NIL_APO1+qOpd8+Gn1 (red dashed lines). The shaded areas in C–H represent the 95% confidence bands.

