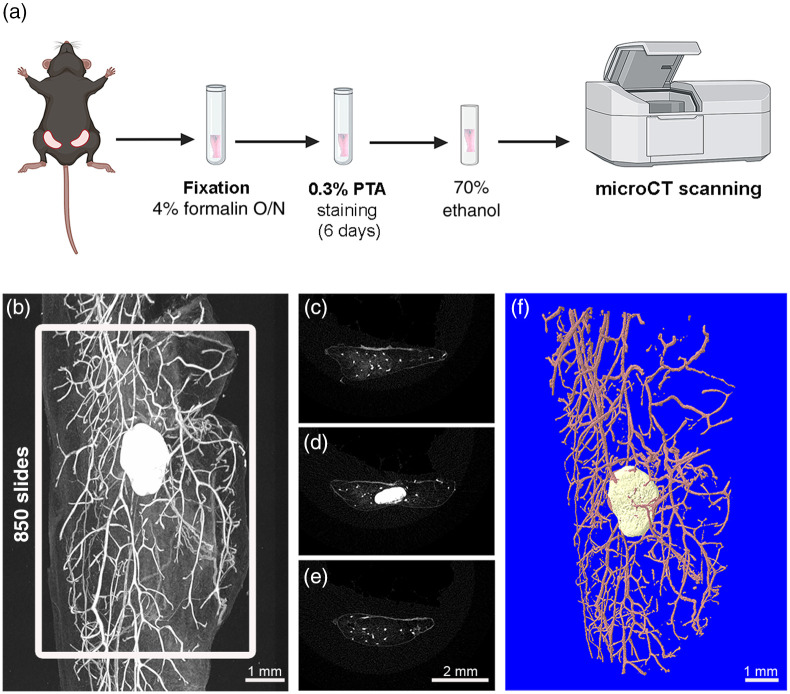
Fig. 2.
2D and 3D imaging of mouse mammary gland with PTA-enhanced microCT. (a) Schematic overview of PTA staining protocol and subsequent microCT scanning of abdominal mammary gland tissue. Created with BioRender.com. (b) Acquisition of 2D representative microCT image of mammary gland after PTA staining using CTan software. White frame illustrates the area of interest containing 850 contiguous slides including the lymph node. (c–e) Transverse sections of mammary gland from proximal to distal regions showing ductal epithelium as white spots and lymph node in panel D. (f) 3D reconstructed image of the mammary ductal tree (pink) and lymph node (beige) using CTvol software (Bruker).

