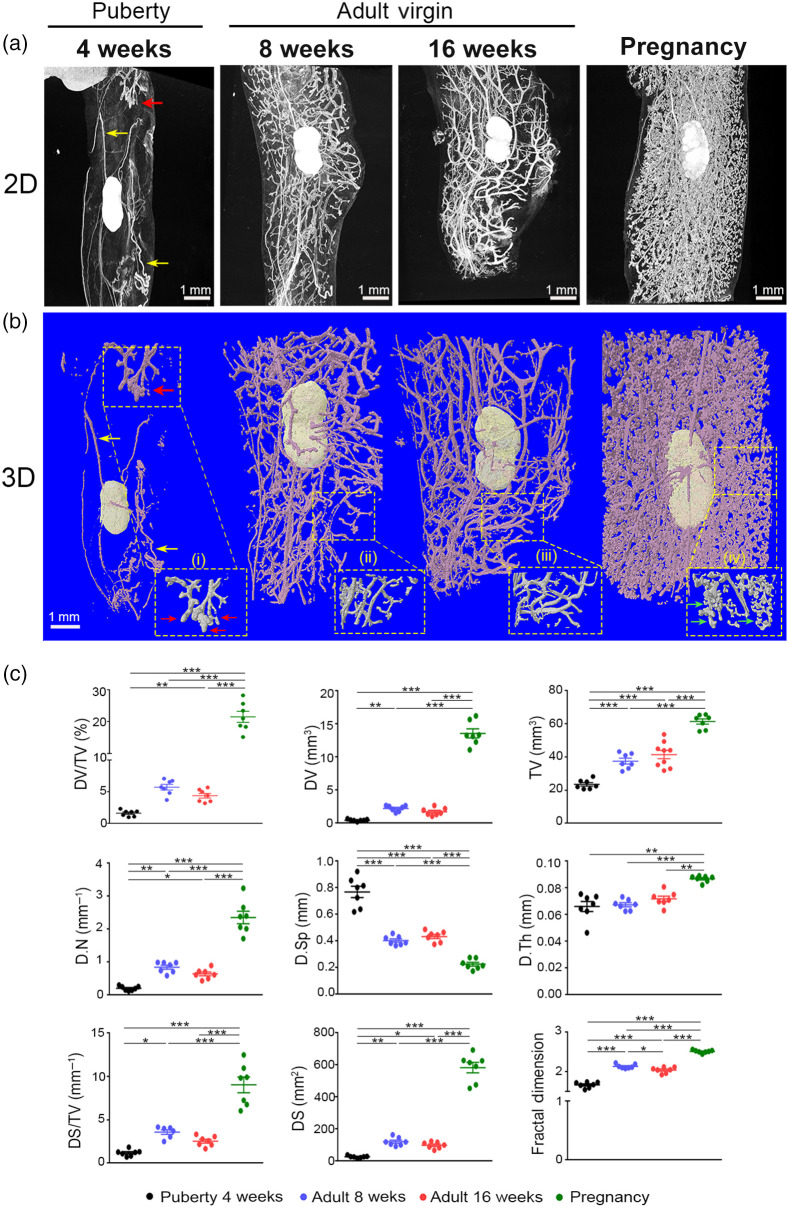
Fig. 3.
3D imaging and quantification analysis of the abdominal mammary gland during distinct developmental stages with PTA-enhanced microCT. (a) Representative 2D microCT images and (b) 3D reconstruction images of the mammary ductal tree from puberty to adult virgin and pregnancy. Selected regions were magnified as shown by dashed line squares depicting (i) the formation of TEBs (showed by red arrows), (ii, iii) ductal elongation in mature mammary gland, and (iv) alveolar formation during pregnancy (showed by green arrows). Yellow arrows at 4 weeks show vessels. (c) Quantitative analysis of mammary epithelium during the four distinct developmental stages ( per group). Data are shown as mean values ± SEM. One-way ANOVA, and Tukey post-hoc test was performed for statistical analysis (*, **, ***).

