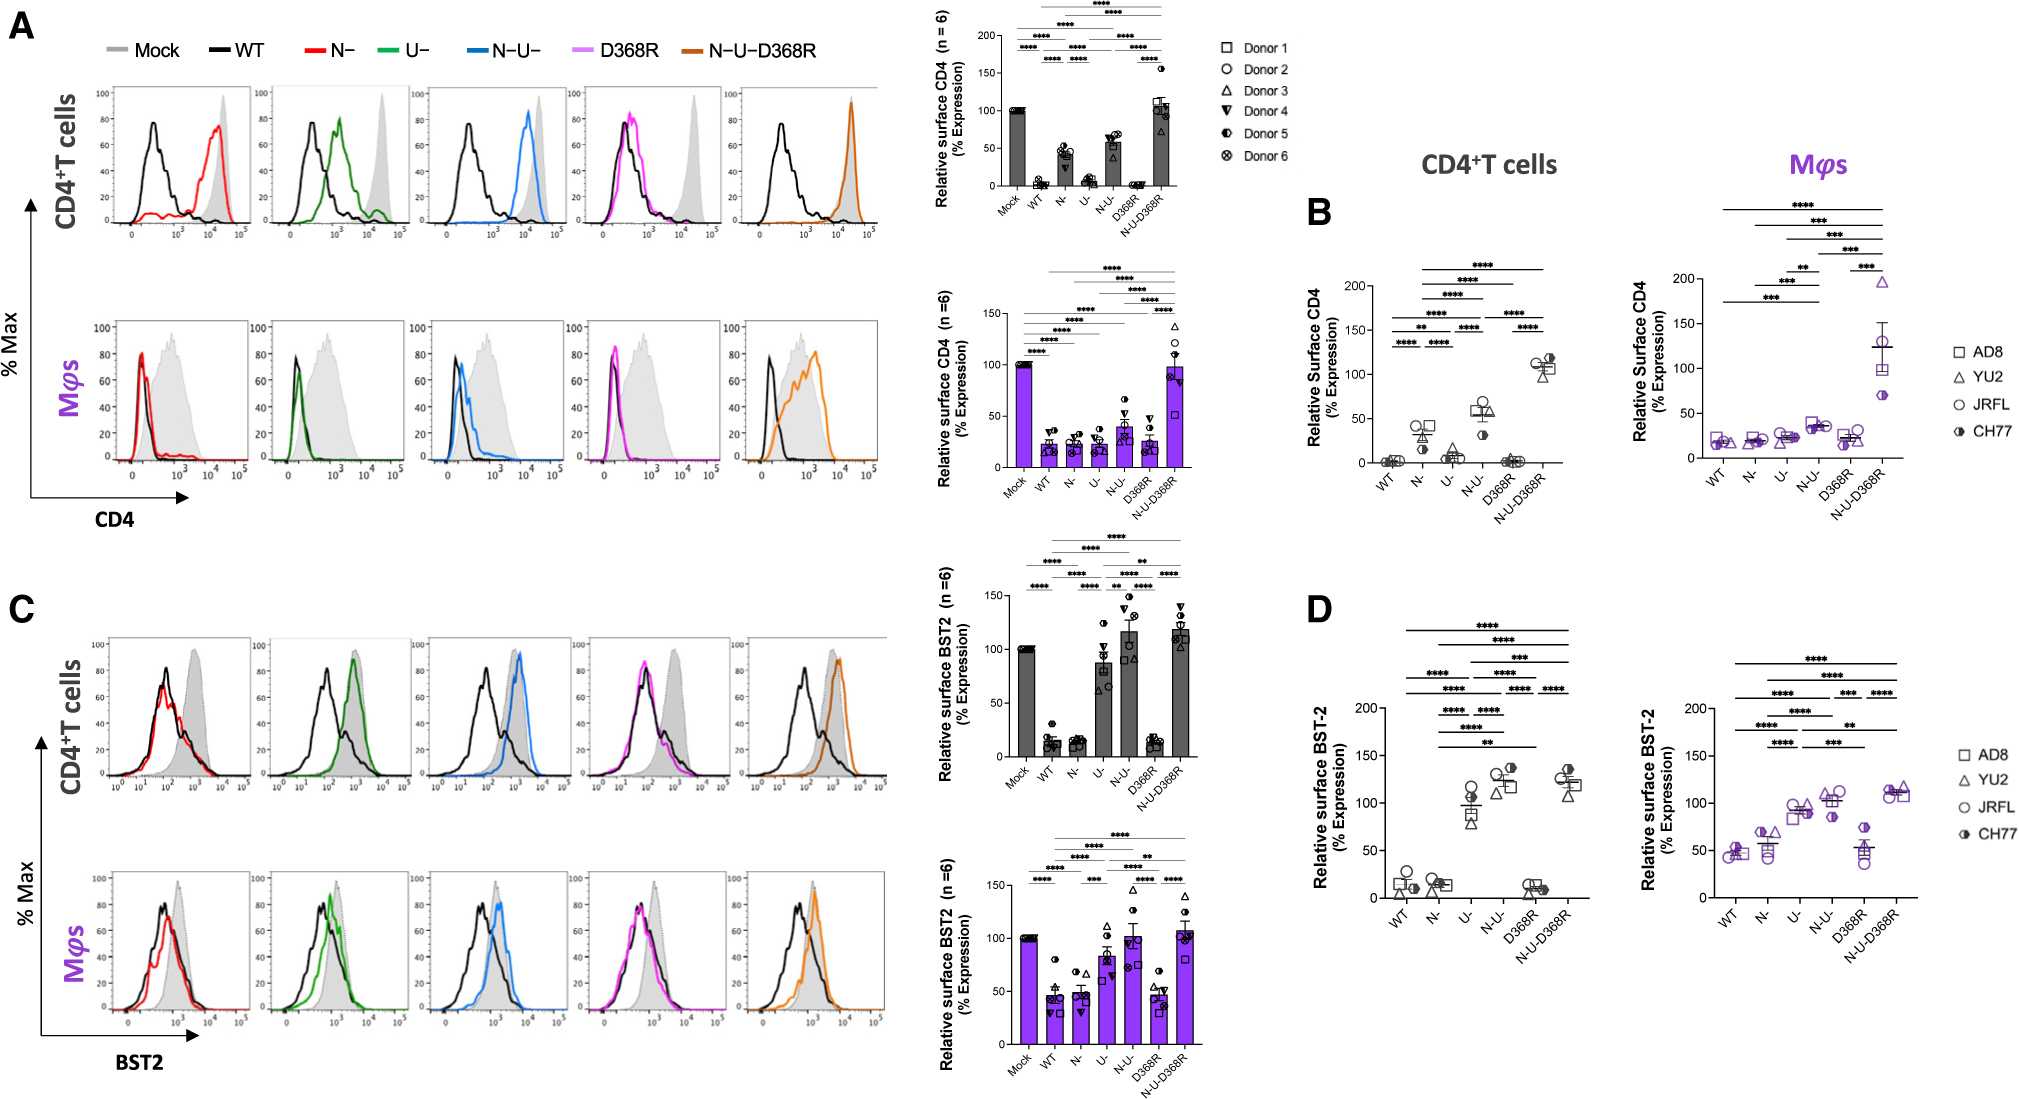
Figure 1. CD4 and BST2 downregulation in HIV-1-infected primary CD4+ T cells and autologous macrophages.

Autologous CD4+ T cells and macrophages were infected with the HIV-1AD8 panel of viruses (WT, Nef-defective [N–], Vpu-defective [U–], or both Nef and Vpu [N–U–] and CD4BS mutant [D368R] and N-U-D368R mutant), and CD4 and BST2 levels were determined 48 h later (CD4+ T cells) or 5 days after infection (macrophages).
(A) Relative surface levels of CD4 on CD4+ T cells and macrophages. Histograms (left) depict representative staining of infected cells and bar graphs (right) show percent fold change in CD4 expression relative to mock (p24+/uninfected cells).
(B) Summary of relative surface levels of CD4 on CD4+ T cells and macrophages infected with a panel of viruses (WT, Nef-defective [N–], Vpu-defective [U–], or both Nef and Vpu [N–U–] and CD4BS mutant [D368R] and N-U-D368R mutant) from HIV-1AD8, HIV-1JR-FL, HIV-1CH77, and HIV-1YU2.
(C) Relative surface expression of BST2 on CD4+ T cells and macrophages. Histograms (left) depict representative staining of infected cells, and bar graphs (right) show percent fold change in BST2 expression of p24+ relative to p24− cells (p24+/p24−).
(D) Summary of relative surface expression of BST2 on CD4+ T cells and macrophages infected with a panel of viruses (WT, Nef-defective [N–], Vpu-defective [U–], or both Nef and Vpu [N–U–] and CD4BS mutant [D368R] and N-U-D368R mutant) from HIV-1AD8, HIV-1JR-FL, HIV-1CH77, and HIV-1YU2. Error bars indicate mean ± SEM. Statistical significance was tested using two-way ANOVA (A and C; n = 6 donors) or mixed effect analysis (B and D; n = 4 viruses) with Holm-Sídák’s multiple comparisons test (*p < 0.05; **p < 0.001; ***p < 0.0001; ns, non-significant).
