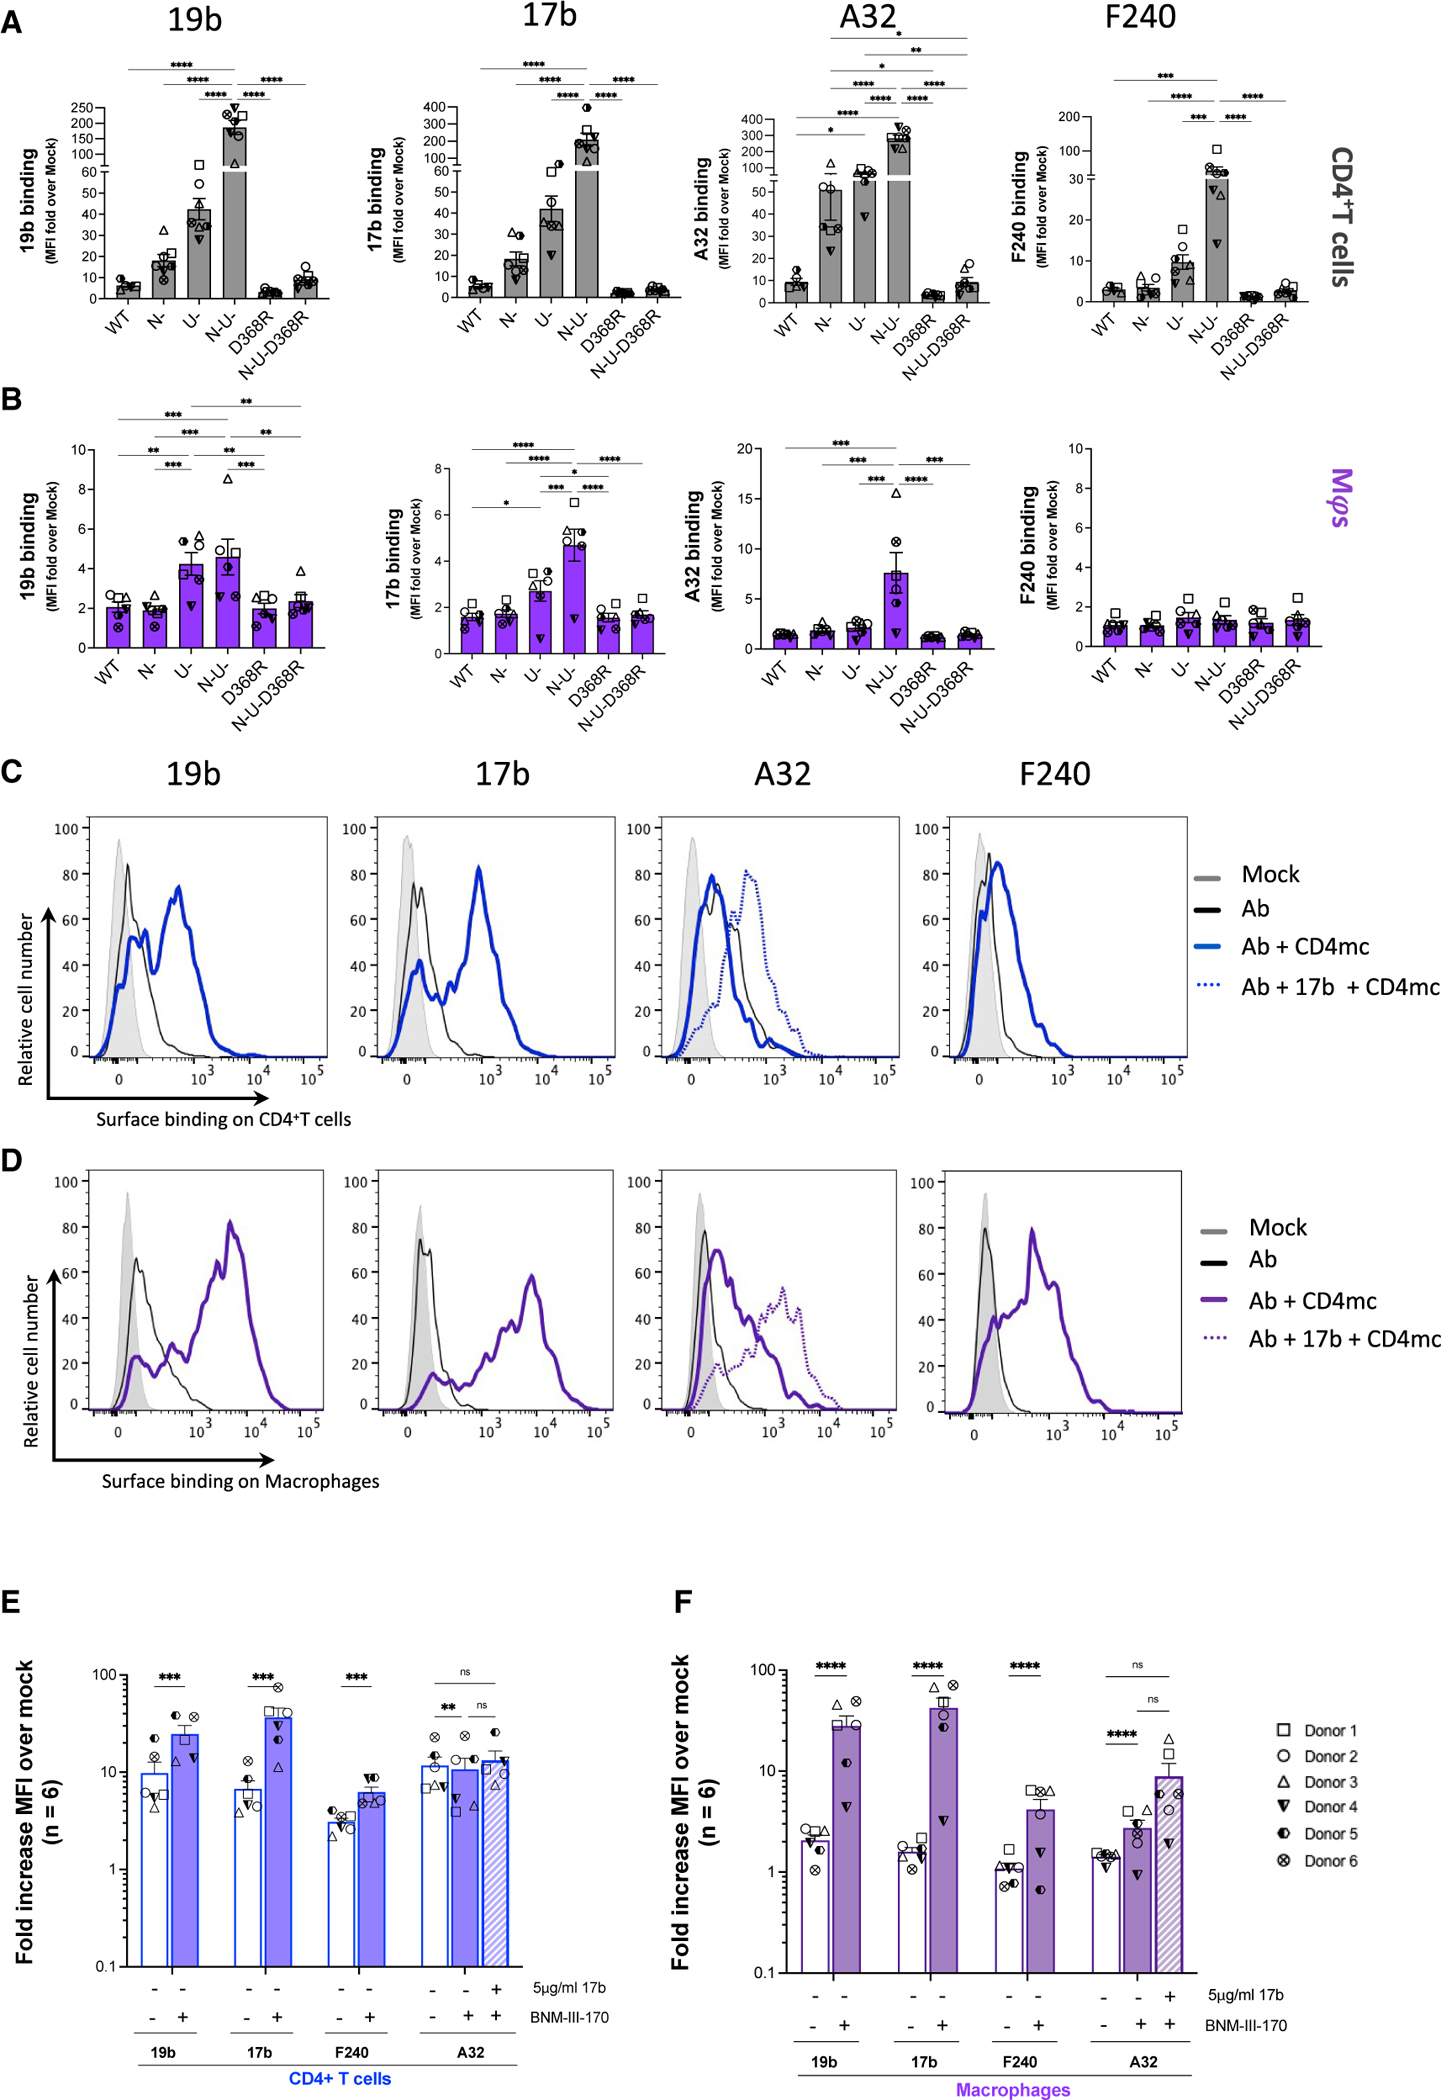
Figure 3. Recognition of HIV-1-infected primary CD4+ T cells and autologous macrophages by non-neutralizing antibodies.

Autologous (A and C) CD4+ T cells and (B and D) macrophages infected with the HIV-1AD8 panel of viruses (WT, Nef-defective [N–], Vpu-defective [U–], or both Nef and Vpu [N–U–] and CD4BS mutant [D368R] and N–U–D368R mutant) for 48h (CD4+ T cells) or 5 days (macrophages) were stained with non-neutralizing antibodies 19b (V3 crown), 17b (co-receptor binding site), A32 (anti-cluster A), and F240 (gp41-disulfide loop region). Histograms depict representative staining of infected cells of 19b, 17b, F240, and A32 with or without CD4mc BNM-III-170 or A32 with 17b and CD4mc. Fold increase in nnAb binding for CD4+ T cells (E) and macrophages (F), relative to mock/uninfected cells, in the presence of the CD4mc is shown on the y axis. Error bars indicate mean ± SEM. Statistical significance was tested using two-way ANOVA with Holm-Šídák’s multiple comparisons test (A and B) or mixed effect analysis (E and F). (*p < 0.05; **p < 0.001; ***p < 0.0001; ns, non-significant). Shown are data from 6 donors.
