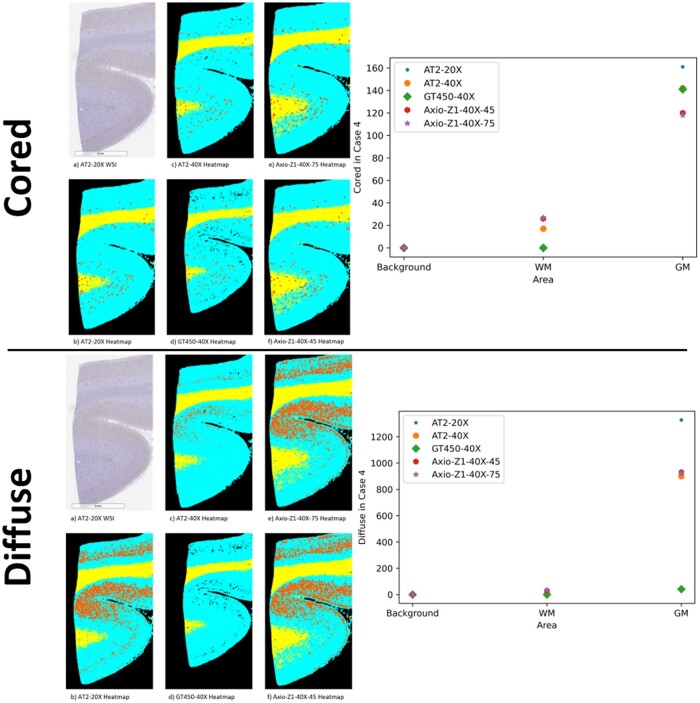
Figure 3.
Schematic of heatmaps of white matter (WM)/gray matter (GM) segmentation and plaques counts for case 4. Top panel—GM/WM cored plaque heatmap (left) and counts by area based on select preanalytic variables (right). Bottom panel—GM/WM diffuse plaque heatmap (left) and counts by area based on select preanalytic variables (right). A zoomed-in area (not the whole slide image) of case 4 was chosen to aid in visualization. For heatmaps, plaques are depicted in orange, background as black, WM as yellow, and GM as cyan.

