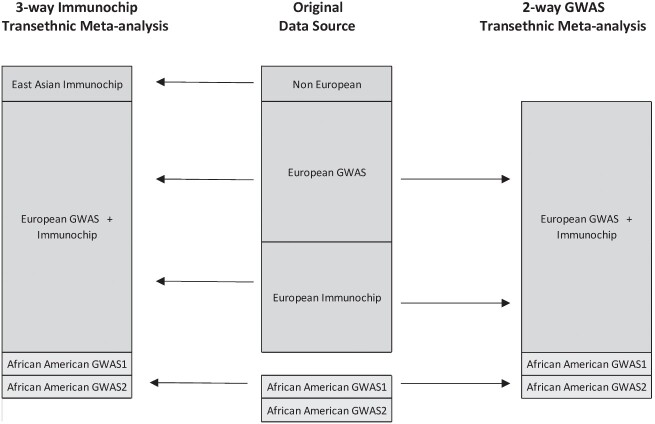
Figure 1.
Diagram of source population data sets with cases and controls. This is an illustration of the source data sets used in the current trans-ancestry association analysis. The top box in the center of the figure represents the breakdown of cases and controls by population used in the 2015 meta-analysis (5). The bottom box in the center of the figure depicts the breakdown of cases and controls used in the AA GWAS meta-analysis (1).

