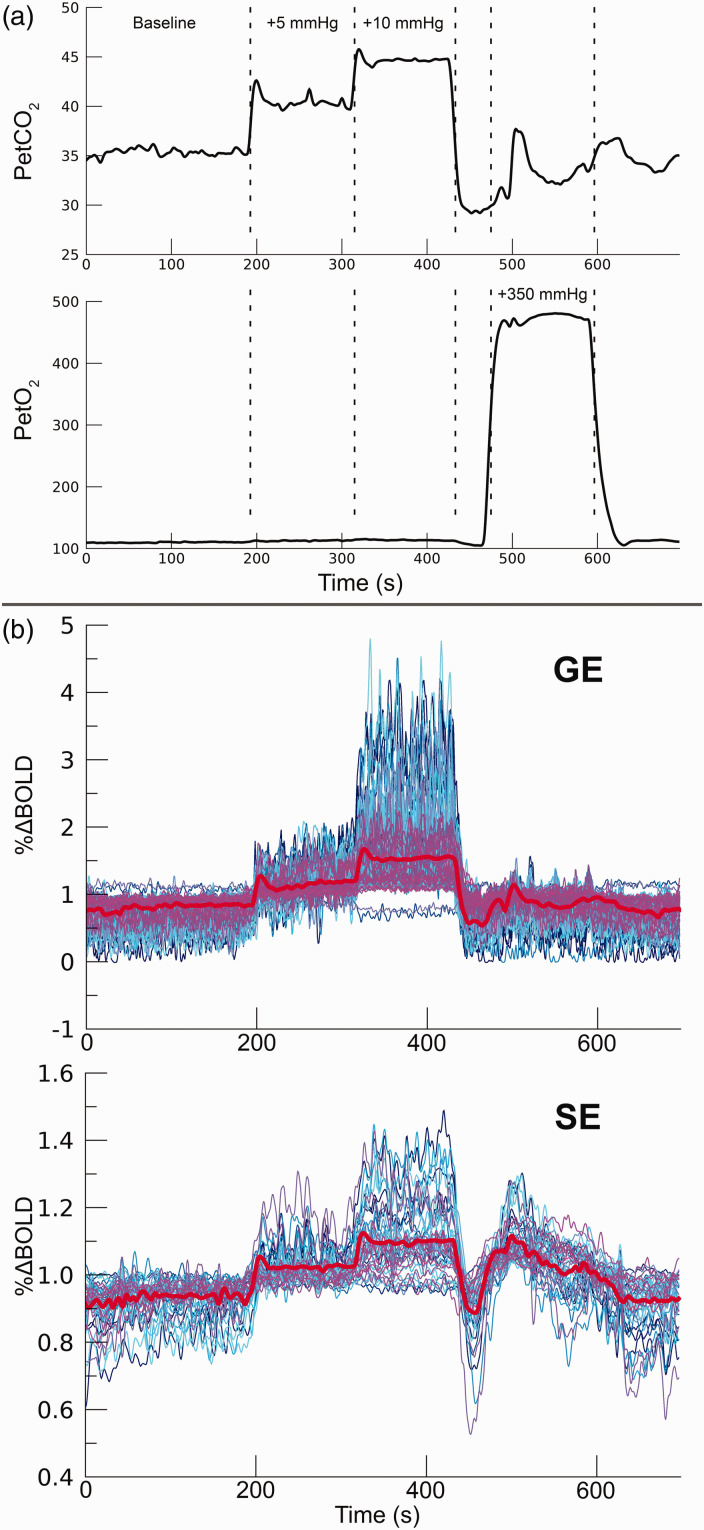
Figure 1.
Breathing protocol. a) For 1 participant (subj08) the RespirAct™ measured breathing traces are shown for PetCO2 (top panel) and PetO2 (bottom panel). The dashed lines depict the hypercapnic conditions (+5 mmHg & +10 mmHg PetCO2), and the hyperoxic condition (+350 mmHg PetO2). For 7 participants the experiment was repeated with the +5 mmHg and +10 mmHg PetCO2 hypercapnic conditions replaced by +3 mmHg and +8 mmHg PetCO2, respectively. b) functional timeseries (subj08) of 100 best voxels on the basis of t-statistics from GE BOLD (top panel) and 50 best voxels from SE BOLD (bottom panel). This particular set of voxels is selected for display purposes only, while the analysis was performed on the selection of statistically significant voxels (see also Statistical analysis). The mean timeseries is depicted by the thick red line.

