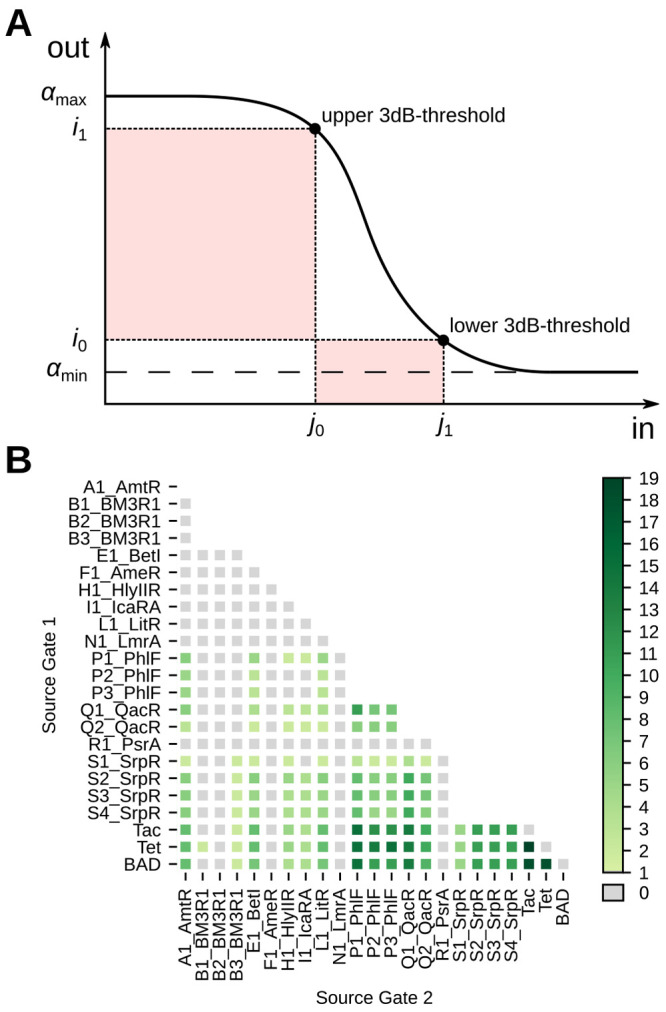
Figure 2.

(A) Visualization of the 3 dB-thresholds on which the signal compatibility analysis is based. i0, i1 represent the output values at the upper and lower threshold respectively, and j1, j0 the corresponding input values. (B) Compatibility of gates in Cello’s library. For each pair of source gates, the number of compatible target gates is presented. Interestingly, there is a significant number of pairs not compatible with any subsequent NOR gate. This limits the number of gates available for assignment at a distinct position within the circuit.
