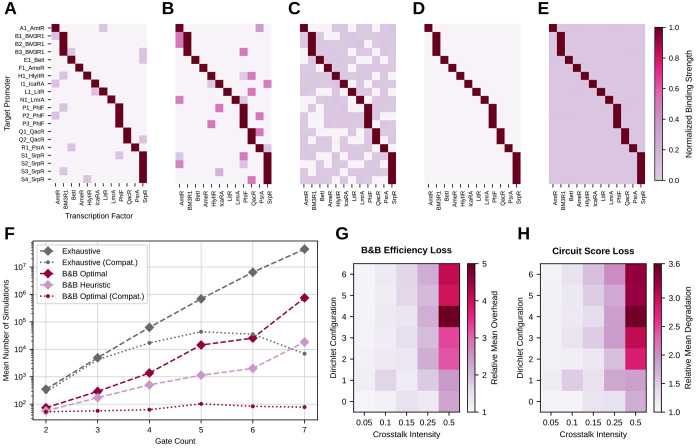
Figure 4.
(A–E) Different distributions and total intensities of the considered crosstalk. (A) very peaked distribution, low total intensity. (B) Very peaked distribution, large total intensity. (C) Distribution with moderate entropy, moderate total intensity. (D) Distribution almost uniform, high entropy, low total intensity. (E) Distribution almost uniform, high entropy, large total intensity. (F) Mean number of simulations needed for mapping circuits with the proposed B&B methods compared to exhaustive search with respect to the number of gates. All results in this plot depict technology mapping runs without crosstalk. Dashed lines show results without the compatibility constraint, while dotted lines depict results with compatibility. (G) Number of simulations needed for mapping the set of 66 circuits with different crosstalk configurations in relation to the result without crosstalk. As a mapping method, optimal B&B with consideration of compatibility has been used. (H) Mean score of the 66 circuits mapped with optimal B&B with different crosstalk configurations in relation to the scores reached without crosstalk. The color encodes the multiplier needed to map the score with crosstalk to the one without crosstalk.

