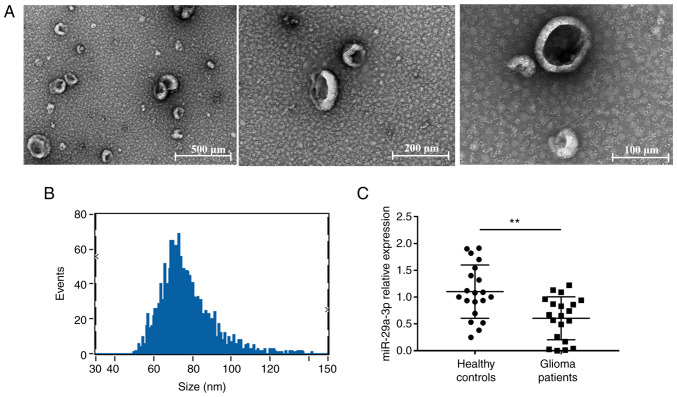
Figure 1.
Plasma exosome expression of miR-29a-3p in healthy controls and glioma patients. Identification and analysis of particle size by transmission electron microscopy of peripheral blood exosomes. (A) Exosomes by transmission electron microscopy. (B) Peak diagram of exosome particle size. (C) Reverse transcription-quantitative PCR showed the expression levels of miR-29a-3p in plasma exosomes in healthy controls (n=20) and glioma patients (n=20). Data were expressed as the mean ± standard deviation and the experiment was repeated three times for each group, **P<0.01. miR, microRNA.

