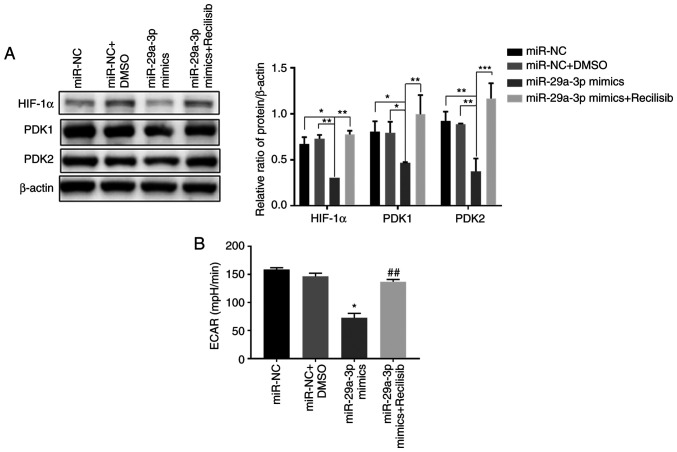
Figure 5.
The effect of miR-29a-3p on glycolysis levels in glioma cells. (A) The expression levels of HIF-1α, PDK1 and PDK2 were detected by western blotting, *P<0.05, **P<0.01, ***P<0.001. (B) The level of glycolysis in each group was detected by Seahorse energy metabolism assay; *P<0.05 vs. miR-NC, ##P<0.01 vs. miR-29a-3p mimics. All data were expressed as the mean ± standard deviation (n=3). miR, microRNA; HIF-1α, hypoxia-inducible factor 1; PDK, pyruvate dehydrogenase kinase; NC, negative control.

