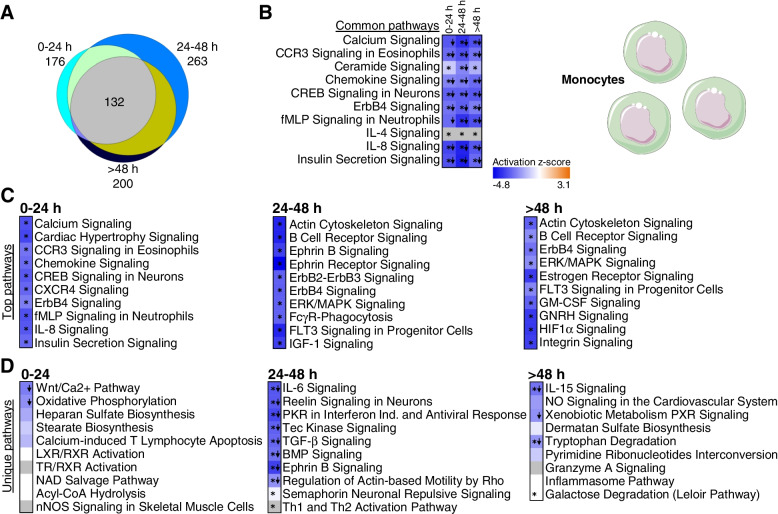
Fig. 2.
Enriched pathways in monocytes. A Venn diagram represents all enriched pathways in monocytes at 0–24 h, 24–48 h, and >48 h (Fisher’s p-value<0.05). In total, 132 pathways overlapped all three time points. B Top 10 pathways enriched and shared at all time points. C Top 10 over-represented pathways with predicted inhibition (z≤ −2, blue shades) in every time point. D Top 10 over-represented pathways unique to each time point (Fisher’s p-value<0.05). Down arrows indicate significant predicted inhibition of pathway (z≤ −2). Blue cells indicate negative z-score, white cells indicate no direction can be predicted, and grey cells are those where no prediction can be performed. (*= Benjamini–Hochberg corrected p-value<0.05). FcγR-Phagocytosis: Fcγ receptor-mediated Phagocytosis in Macrophages and Monocytes; Ind, induction

