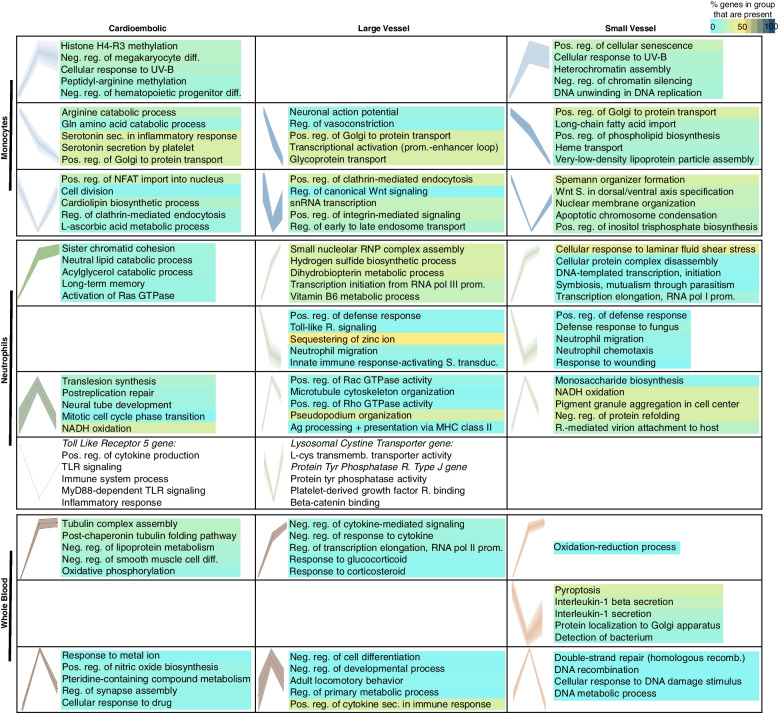
Fig. 8.
Distinctive gene expression trajectories over time for different causes of IS based upon self-organizing maps (SOM). DEG trajectories across time (0 h, 0–24 h, >24 h)) are shown for cardioembolic (CE), large vessel (LV), and small vessel (SV) causes of strokes in monocytes, neutrophils, and whole blood. Dots on each profile represent every time point from left to right. Rows show similar expression profiles across stroke etiology in each sample type; empty cells indicate no matching profile was found in that sample type / etiology combination. The top enriched Gene Ontology (GO) terms for biological processes are shown for each profile. The color corresponds to the percentage of genes in the GO group present in the profiles. Abbreviations: Ag: antigen; reg: regulation; diff: differentiation; neg.: negative; pos.: positive; prom: promoter; R: receptor; recomb: recombination; RNP: ribonucleoprotein; sec.: secretion; S.: signal/signaling; TLR: Toll-like receptor; transduc: transduction; transmemb.: transmembrane

