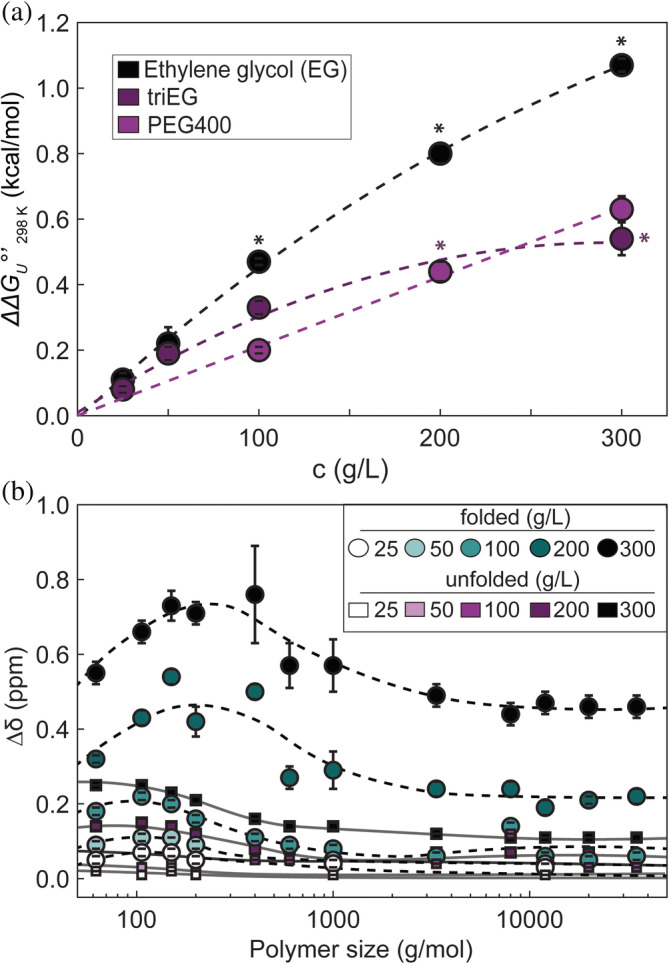
FIGURE 2.

Stabilizing effects of small PEGs as a function of concentration at 298 K (a), PEG‐induced 19F chemical‐shift perturbation (b). Values excluded from calculation of m‐values are labeled with asterisks. 19F ; folded, teal; unfolded, purple. Error bars denote standard deviation of the mean from triplicate experiments. The curves are of no theoretical significance.
