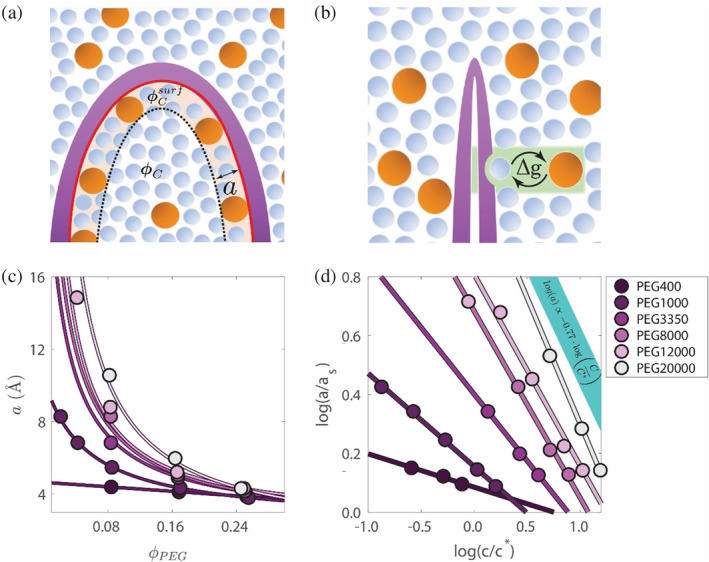
FIGURE 3.

Protein unfolding models. Schematics of exclusion (a) and adsorption (b). The protein, cosolute, and solvent are shown in purple, orange, and blue, respectively. The surface domain (shaded yellow) thickness is indicated by , and the relavent surface area of size is depicted in red. Since the protein domain in the exclusion model corresponds only to the interface that is buried in the folding process, only that part of the surface is marked. In panel b, the adsorption site and processes are shaded green. Values of that reproduce the experiment‐based unfolding free energies (c). Log–log plot of scaled to normalized mass concentration (d). scaling shown by linear fits; the blue bar represents the theoretical scaling law for polymer mesh size, , in the semi‐dilute regime (de Gennes 1979).
