
FIGURE 5.
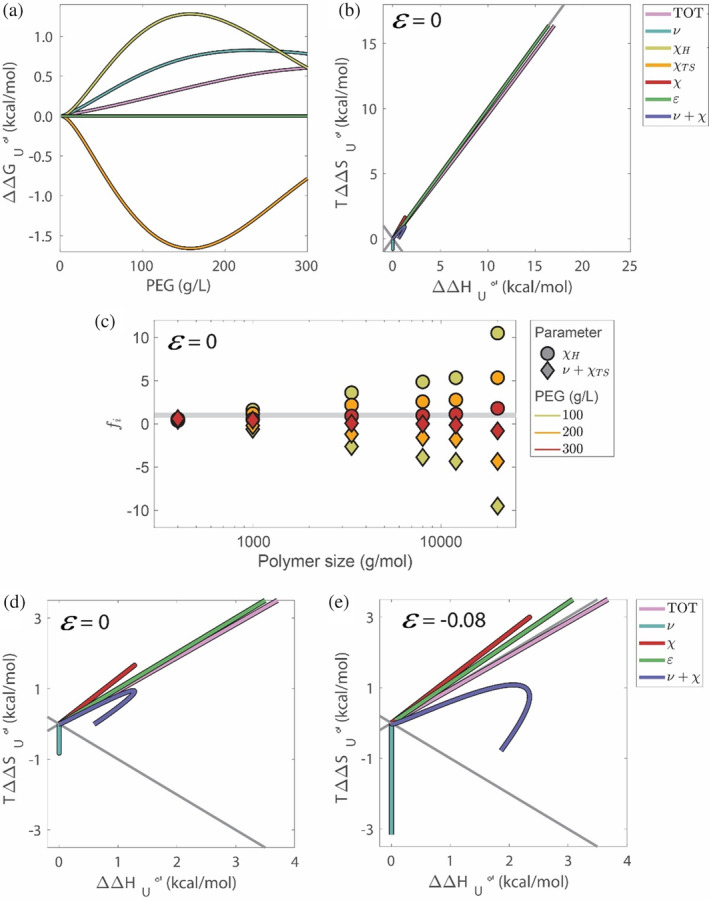
Contributions of , , , and with and without chemical interactions at 298 K. Contributions for PEG8000 to (a) and versus (b), for . Relative contributions, , of and to the total free energy compared to buffer for different PEG sizes and concentrations (c). The gray line represents . Low and regime of the entropy–enthalpy plot from panel b for (d), and (e).