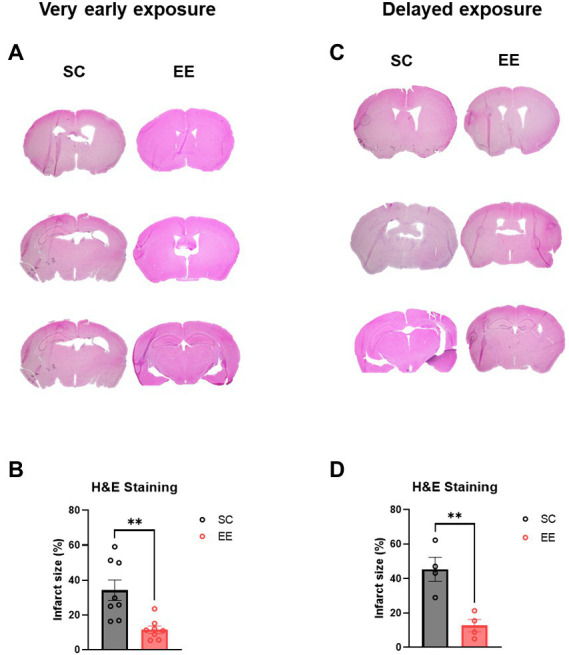
Figure 3.

Histological assessments of the very early and delayed EE exposure groups. (A,B) Representative H&E images (A) and quantification of infarcted volume (B) after very early exposure to EE (n = 8 per group). (C,D) Representative H&E images (C) and quantification of infarcted volume (D) after delayed exposure to EE (n = 4 per group). H and E, hematoxylin–eosin.
