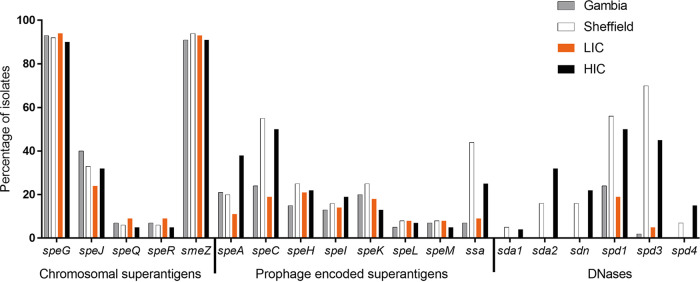
FIG 4.
Comparison of superantigen and DNase gene carriage in LIC isolates and HIC isolates. The proportions of the Gambian LIC isolates (gray bars) and the Sheffield HIC isolates (white bars) as well as the wider LIC isolates (Kenya, Fiji, Gambia; n = 781) (orange bars) and the wider HIC isolates (BSAC, PHE, ABCs, Sheffield; n = 4,820) (black bars) carrying the respective genes were determined by BLAST analysis and mapping.

