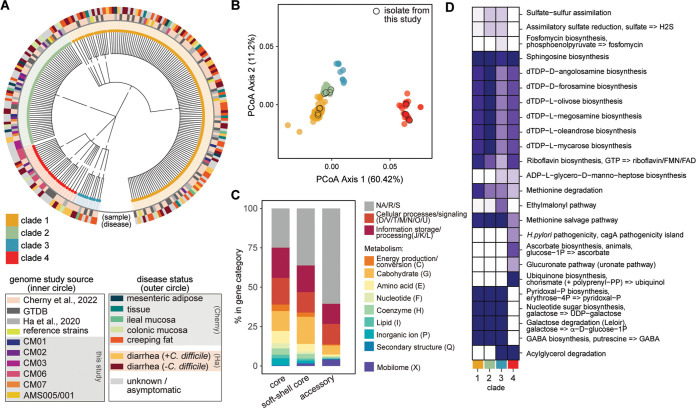
FIG 3.
Clade-specific differences in metabolism and potential virulence drive genomic differences in C. innocuum strains. (A) Maximum-likelihood tree based on single nucleotide polymorphisms in 524 core genes from 500 replications, colored by clade (node color) and source (circle color) as specified in the legend. (B) Principal-coordinate analysis (PCoA) based on a Bray-Curtis distance matrix of COG gene assignments (presence or absence) generated using Prokka, colored by clade (legend) (PERMANOVA; **, P < 0.001). (C) Relative abundance of major COG categories (color coded in the legend) represented in core, soft-shell core, and accessory genes. (D) Differentially enriched KEGG modules across clades (false-detection rate using an adjusted q value below 0.05), colored by fraction of genomes within each clade.

