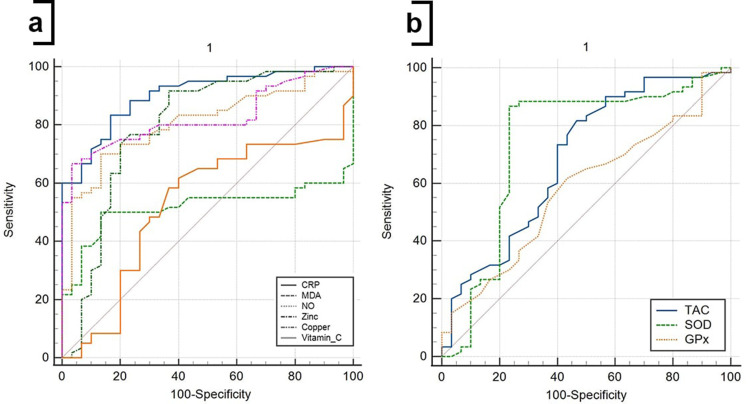
Figure 6.
ROC curve analysis of CRP and oxidative/antioxidant biomarkers for diagnosis of SARS-CoV-2 infection. The ROC curve figure was created by MedCalc 20. (a) ROC curve for CRP, MDA, NO, zinc, copper, and vitamin C; (b) ROC curve for TAC, SOD, and GPx. The participants were divided into HCs and COVID-19 patients, considering as status in the ROC curve analysis.
Abbreviations: CRP, C-reactive protein; GPx, glutathione peroxidase; MDA, malondialdehyde; NO, nitric oxide; SOD, superoxide dismutase; TAC, total antioxidant capacity.

