Fig. 2.
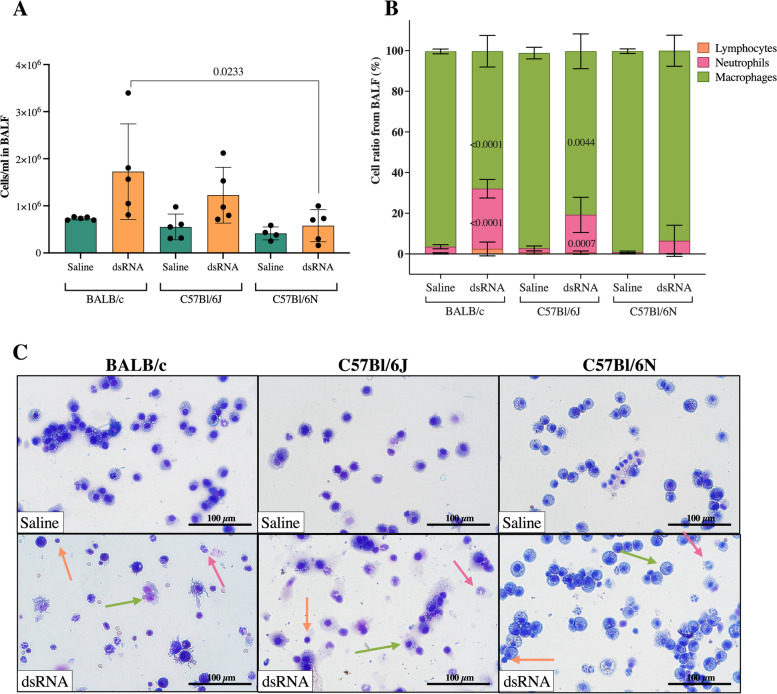
Effect of i.n. dsRNA administration on BALF cellular infiltration in mice. dsRNA (100 µg) or saline were i.n. administered to C57Bl/6J, C57Bl/6N or BALB/c mice once per day for three consecutive days, and cell concentration (cells/ml) (A) and cellular composition (%) (B) were determined in BALF. Representative pictures of BALF composition are shown in (C) (100X magnification). Orange arrows depict lymphocytes, purple arrows depict neutrophils and green arrows depict macrophages. Scale bars indicate 100 µm. Data are presented as mean ± SD. Differences between groups were tested using a 2way ANOVA with Tukey’s multiple comparisons test. P-values of < 0.05 are indicted in the graphs, each data point represents one mouse from one experiment (n = 4–5 per group)

