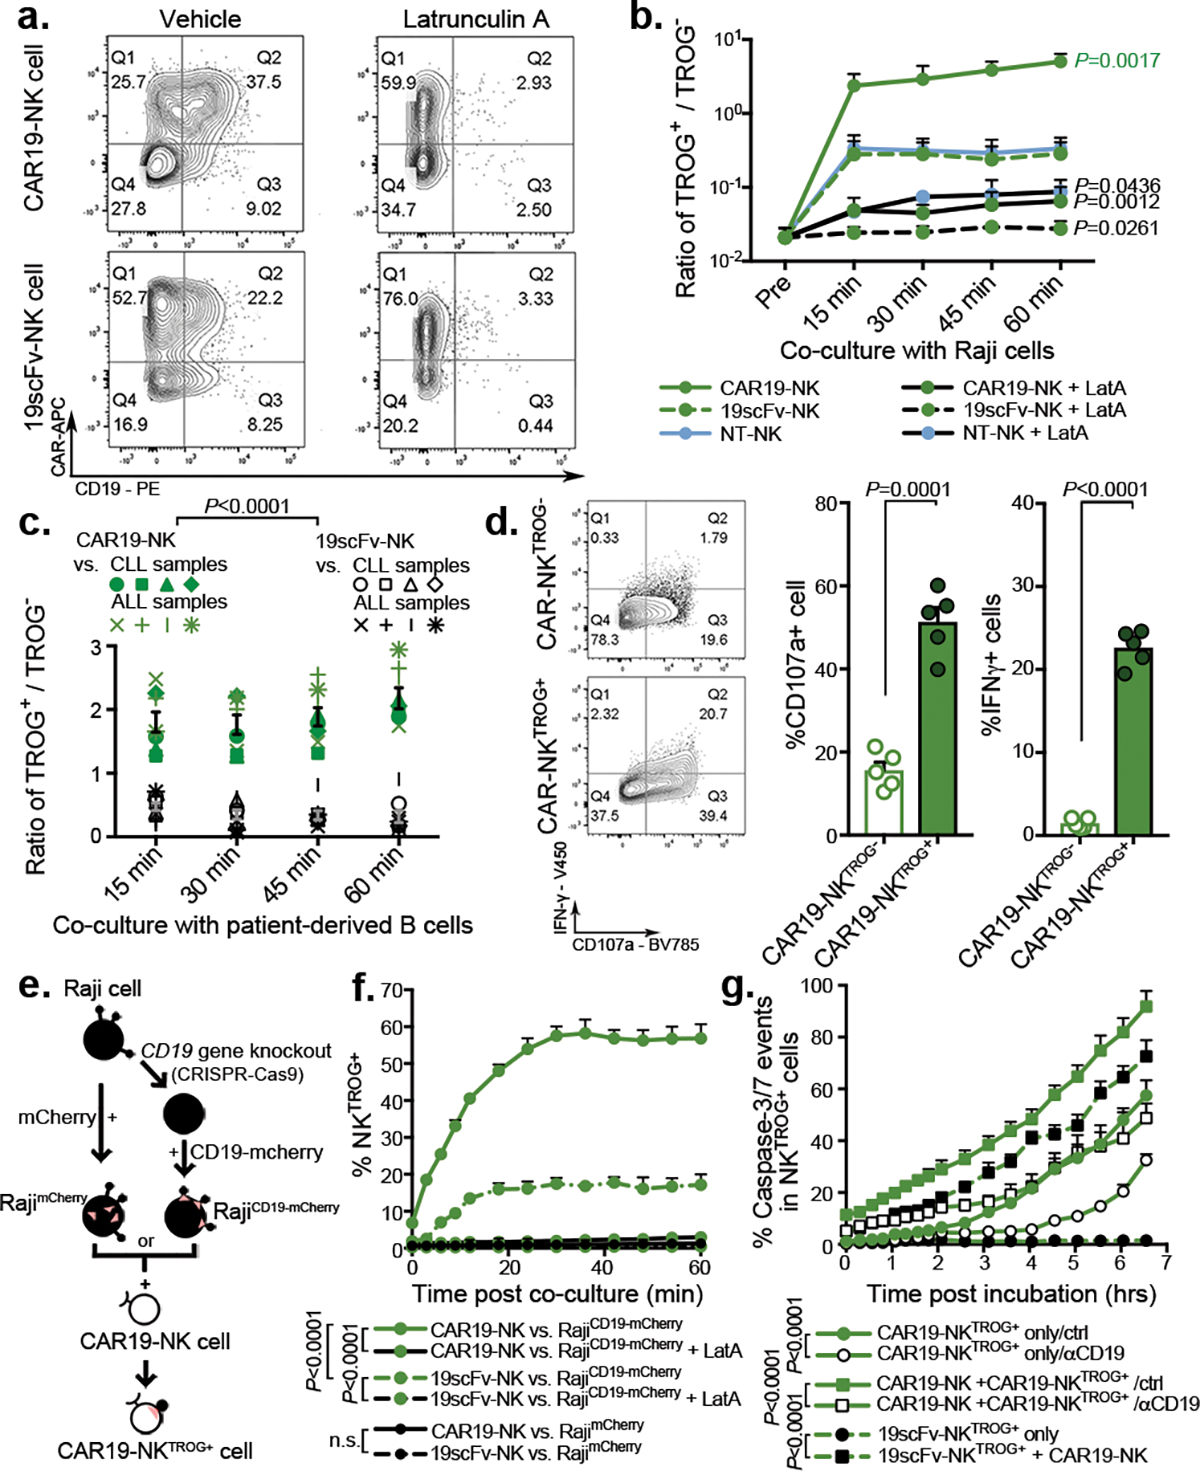
Figure 1. CAR19-mediated trogocytosis in NK cells co-cultured with CD19+ tumor targets.

(a) FACS plots show CD19 expression on NK cells transduced with CAR19 or 19scFv (no intracellular signaling domain) after co-culture with Raji cells for 5 min with Latrunculin A (LatA) or vehicle control (representative for 3 donors). The CD19+ gate was determined based on both fluorescent minus one (FMO) control and by referring to NK cells cultured alone. (b) Trogocytic CD19 (tCD19, shown as the ratio of TROG+/TROG−) expression on singlet CAR19-NK, 19scFv-NK, and NT-NK cells after co-culture with Raji cells (n= 3 donors). TROG+ fractions comprised NK cells expressing CAR+CD19+ (eg. Q2 from panel a), while the TROG− fractions included NK cells expressing CAR+CD19− (eg. Q1 from panel a). (c) tCD19 expression (shown as the ratio of TROG+/TROG−) on singlet CAR19-NK (green symbols) or 19scFv-NK cells (black symbols) after co-culture with B-CLL cells (n=4 patients) or B-ALL cells (n=4 patients). (d) Expression of CD107a and IFN-γ in TROG+ vs. TROG− CAR19-NK cells 6 hrs after stimulation with Raji cells (representative of 3 donors). Bar graphs show the percentage (%) of CD107a+ and IFN-γ+ cells in each fraction normalized to expression in CAR19-NK cells cultured alone (n=5 donors). (e) Strategy for CD19-mCherry fusion protein expression on CD19-knockout Raji (RajiCD19-KO) cells, controlled by Raji cells genetically modified for intracellular mCherry expression (RajimCherry). (f) Percentage (%) of CAR19-NK cells or 19scFv-NK cells expressing mCherry after co-culture with RajiCD19-mCherry cells or RajimCherry in different conditions in an Incucyte assay (representative of 3 donors). (g) Incucyte analyses showing the % of caspase 3/7 events in the TROG+ fraction of CAR19-NK cells vs. 19scFv-NK cells cultured alone, or with autologous fresh CAR19-NK cells. For CAR19-NKTROG+ cells, anti-human CD19 blocking antibody (αCD19) or an antigen-mismatched scFv antibody were added as controls (representative of 3 donors).
P values were determined by two-tailed two-way ANOVA in panels b,c,f,g, or two-sided Student’s paired t test in panel d; n.s.: not significant. Data were shown by mean + s.e.m. Insert numbers indicate % in respective quadrants. Each circle represents an individual donor or experimental replicate.
