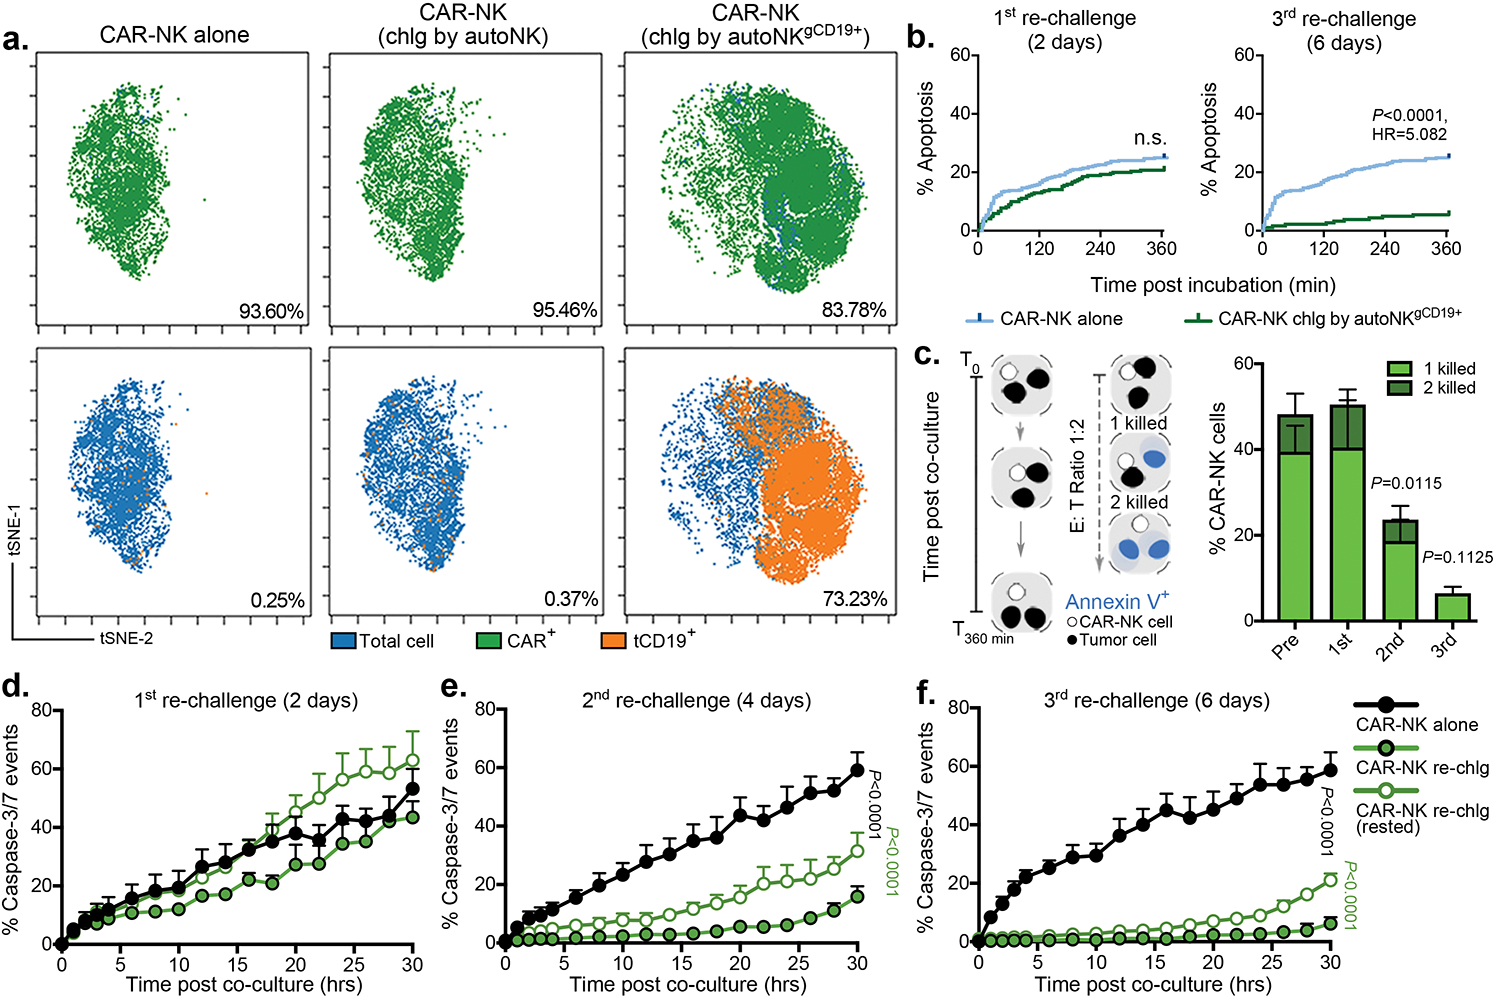
Extended Data Fig. 4. Repeated challenge of CAR19-NK cells with autoNKCD19+ cells result in CAR-NK cell hyporesponsiveness.

(a) tSNE analysis of live hCD45+GFP−CD56+CD3− CAR19-NK cells 4 days following a second round of antigen challenge with autoNKgCD19+gGFP+ cells; controls include CAR19-NK cells cultured alone or co-cultured with autoNKgGFP+ cells for 4 days (lacking CD19 expression). The phenotypic cell signature was evaluated by CyTOF and merged to create a single t-SNE map (10,000 cells from 3 pooled donors per condition). Expression of CAR19 (green) and tCD19 (orange) is determined against NT-NK cell controls. Insert numbers indicate the percentages (%) of CAR and tCD19 expression on CAR19-NK cells. (b) Kaplan-Meier plots showing the percentage (%) of apoptotic Raji cells following co-culture with CAR-NK cell isolated after the 1st round (2 days, left) or 3rd round (6 days, right) of re-challenge with autoNKgCD19+/GFP+ cells compared to fresh CAR-NK cells. Assays were performed in microwells with E:T ratio of 1:1; data were pooled from two donors. (c) Schematic representation of single-cell time-lapse imaging cytotoxicity assay, where a single CAR-NK cell was cultured with two Raji cells. Annexin V influx in Raji cells defined cell apoptosis. The bar plots show the percentage of CAR-NK cells isolated at different time points after re-challenge with autoNKgCD19+/GFP+ cells that succeeded in lysing one (light green) or two (dark green) Raji cells. Fresh CAR-NK cells (pre) were used as control (n= 4 donors for pre, 3 donors for 2nd, and 2 donors for 1st and 3rd challenge). (d-f) Incucyte analyses showing the percentage (%) of caspase 3/7 events in Raji cells co-cultured with CAR19-NK cells isolated after (d) the 1st round, (e) 2nd round, or (f) 3rd round of re-challenge with autoNKgCD19+/GFP+ cells. CAR-NK cells isolated after each round of re-challenge and cultured for 24 hrs in complete media supplemented with 100 U/mL IL-2 (referred to as ‘rested’ cells) were used as controls (representative of 3 donors).
P values were determined by Log-rank test in panel b, two-tailed Student’s paired t test in panel c, or two-tailed two-way ANOVA in panels d,e,f, n.s.: not significant. Data were shown by mean + s.e.m.
