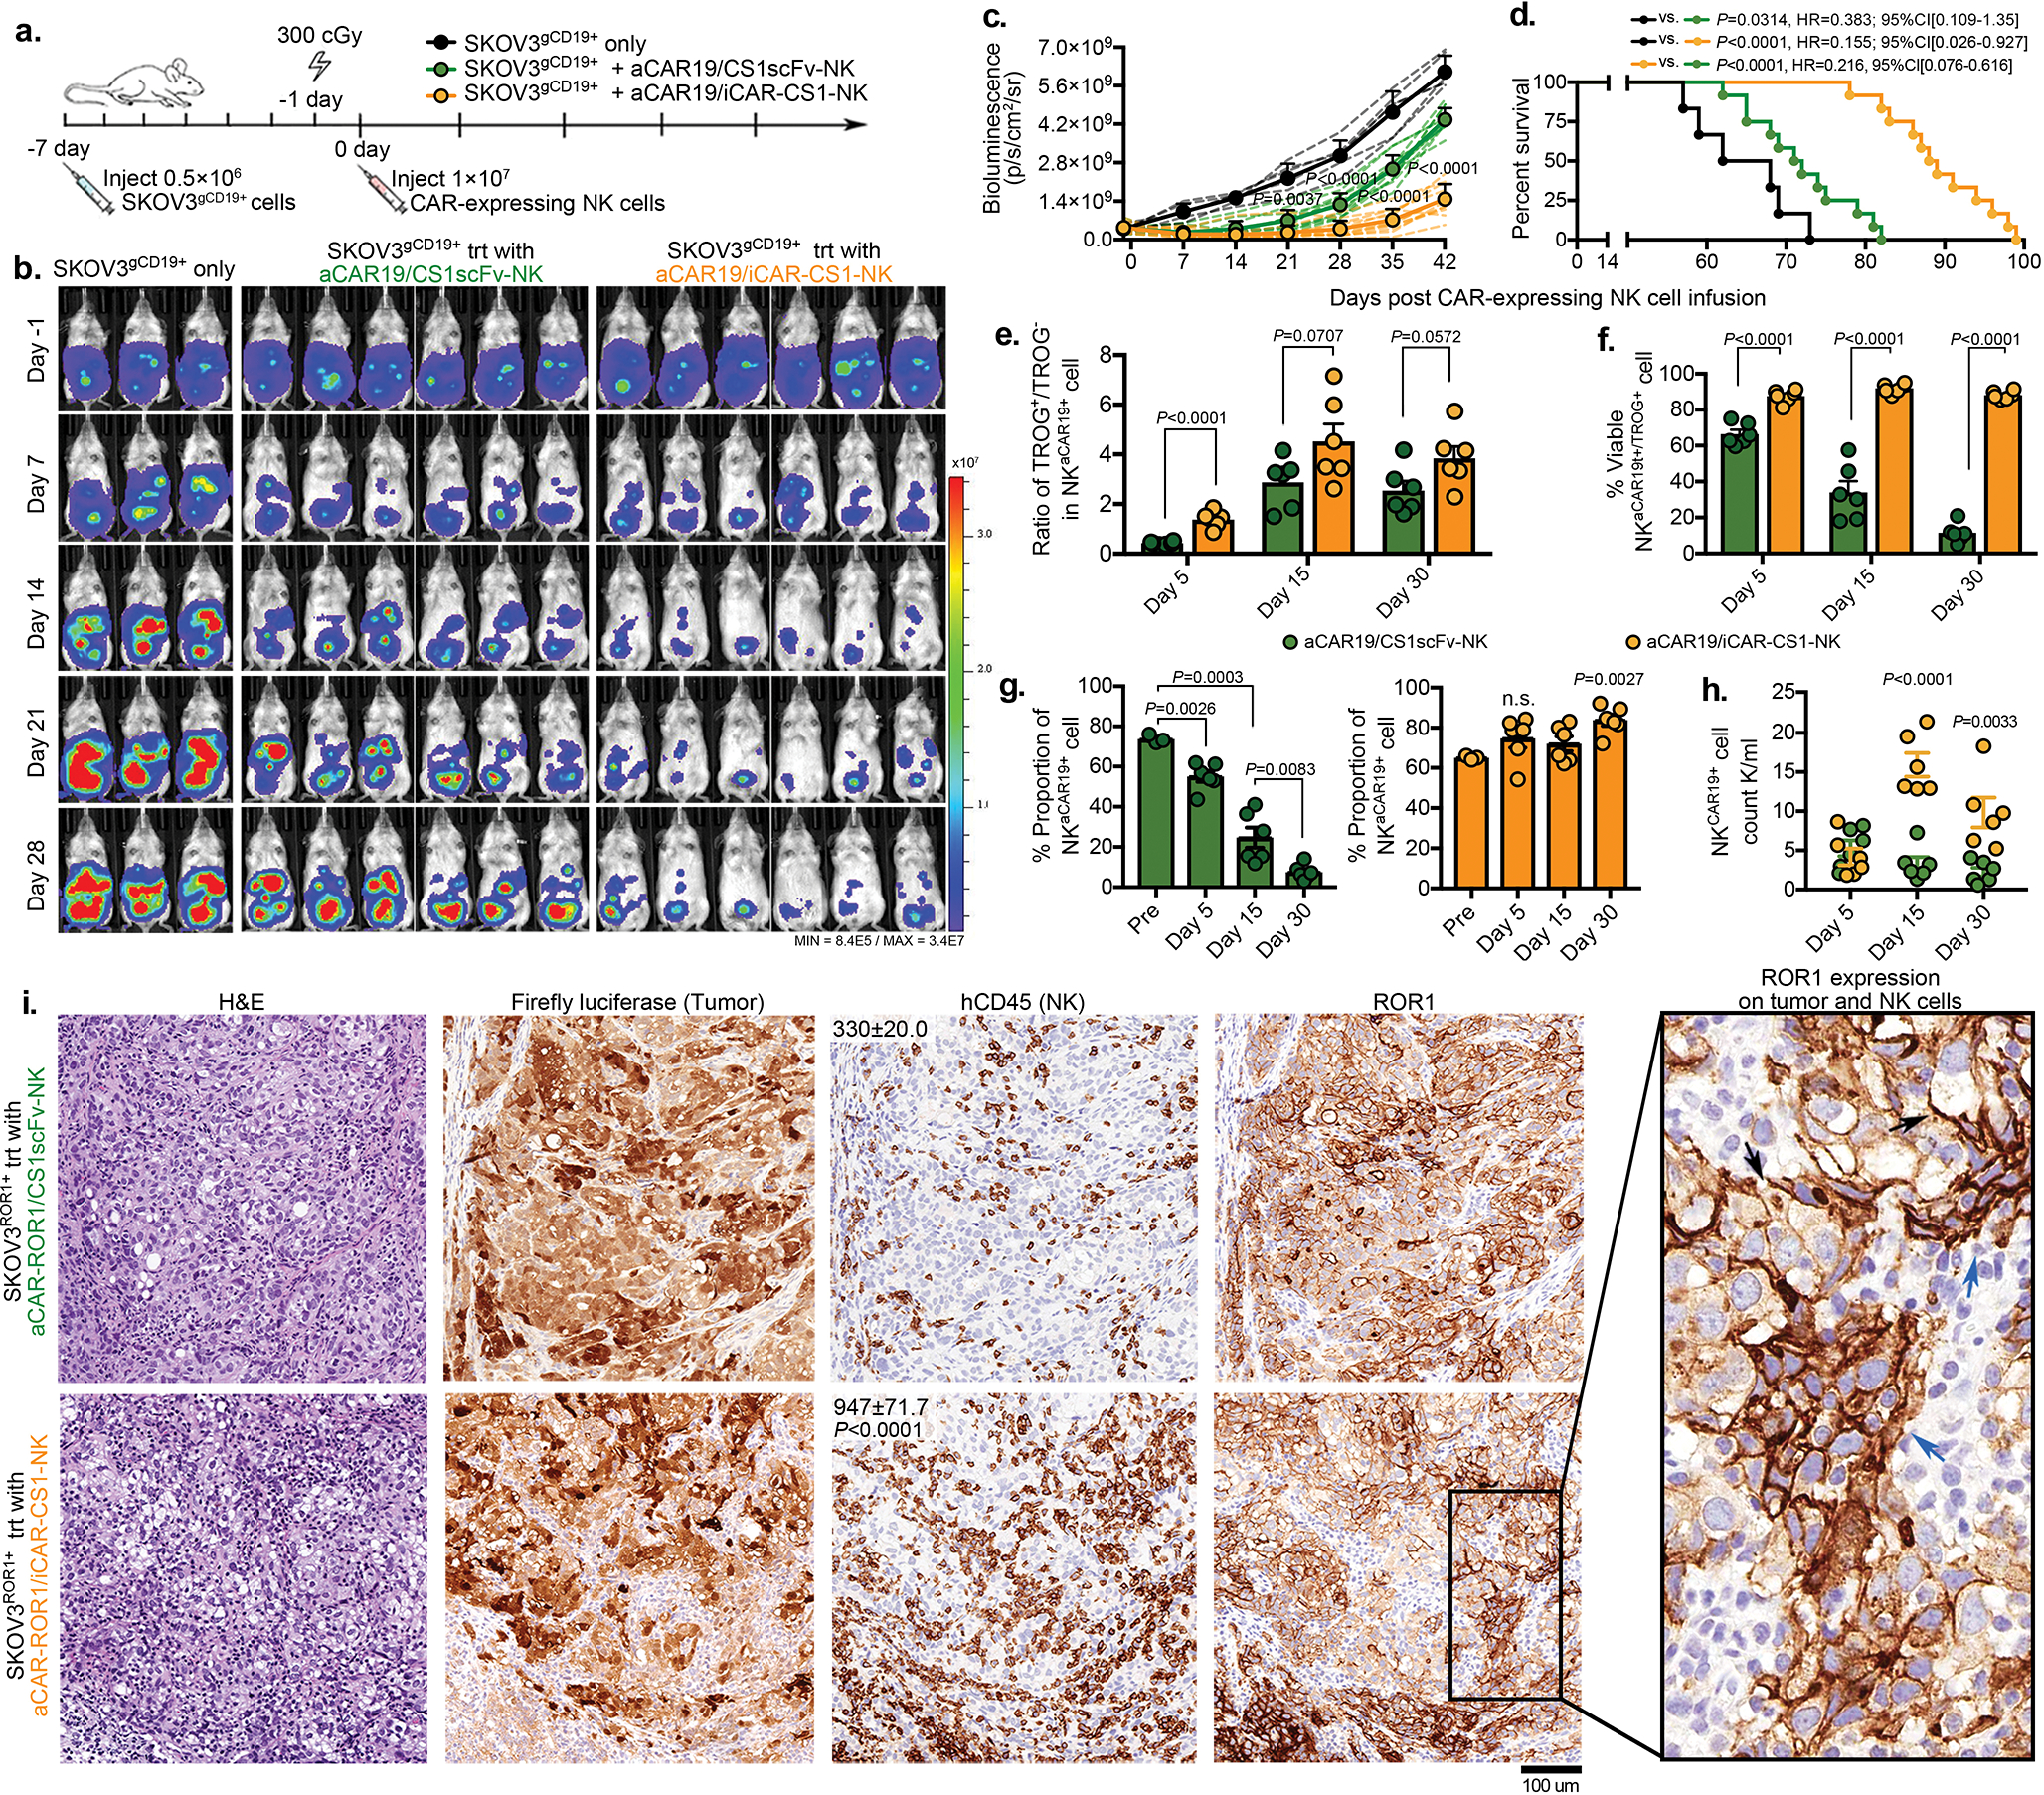
Extended Data Fig. 9. AI-CAR expressing NK cells exert superior in vivo anti-tumor activity in a SKOV3gCD19+ ovarian cancer model.

(a) Schematic illustration of the timeline using a mouse model of SKOV3gCD19+ ovarian cancer. Seven days later, mice received a single infusion of 1×10⁷ NK cells expressing aCAR19/CS1scFv (green), or aCAR19/iCAR-CS1 (orange), or no NK cells (tumor only) (n=5 mice/group). (b and c) Tumor burden as determined by weekly BLI, (b) representative images at select time points are shown; (c) normalized intensity of BLI for each treatment group over the treatment course; dashed lines represent data for each mouse. (d) Kaplan-Meier curves showing survival of mice after NK cell infusion. (e and f) (e) tCD19 (indicated as TROG+/TROG− population) and (f) viability of the TROG+ fraction (NKtCD19+) in the peripheral blood of mice at Days 5, 15, and 30 after infusion of aCAR19/CS1scFv (green) or aCAR19/iCAR-CS1 (orange) NK cells (n=5 mice/group). (g) Percentage (%) of live GFP−CD3−CD56+CAR19+ NK cells in the peripheral blood of mice at Days 5, 15, and 30 after infusion of aCAR19/CS1scFv (green, left) or aCAR19/iCAR-CS1 (orange, right) NK cells (n=5 mice/group). (h) Live NKCAR19+ NK cell counts in the peripheral blood of mice at Days 5, 15, and 30 after infusion of aCAR19/CS1scFv (green) or aCAR19/iCAR-CS1 (orange) NK cells (n=5 mice/group). (i) Representative images showing H&E and IHC staining with anti-Luciferase, anti-hCD45, or anti-hROR1 antibodies on sections from the mesentery tissue of SKOV3ROR1+ grafted mice treated with aCAR-ROR1/CS1-scFv NK cells or aCAR-ROR1/iCAR-CS1 NK cells. Inserted numbers indicate hCD45+ cell count per 0.1 mm2. Black arrows indicate ROR1 expression on tumor cells; blue arrows indicate ROR1 expression on NK cells; scale bar indicates 100 μm.
P values were determined by two-tailed Student’s t test in panels c, e,f,h,i,g, Log-rank test in panel d; n.s.: not significant. Date was pooled from two independent experiments in panels c and d, where NK cells were derived from different donors, or assessed by flow cytometry in panels e,f,g,h and shown by mean + s.e.m. Each circle represents an individual mouse sample.
