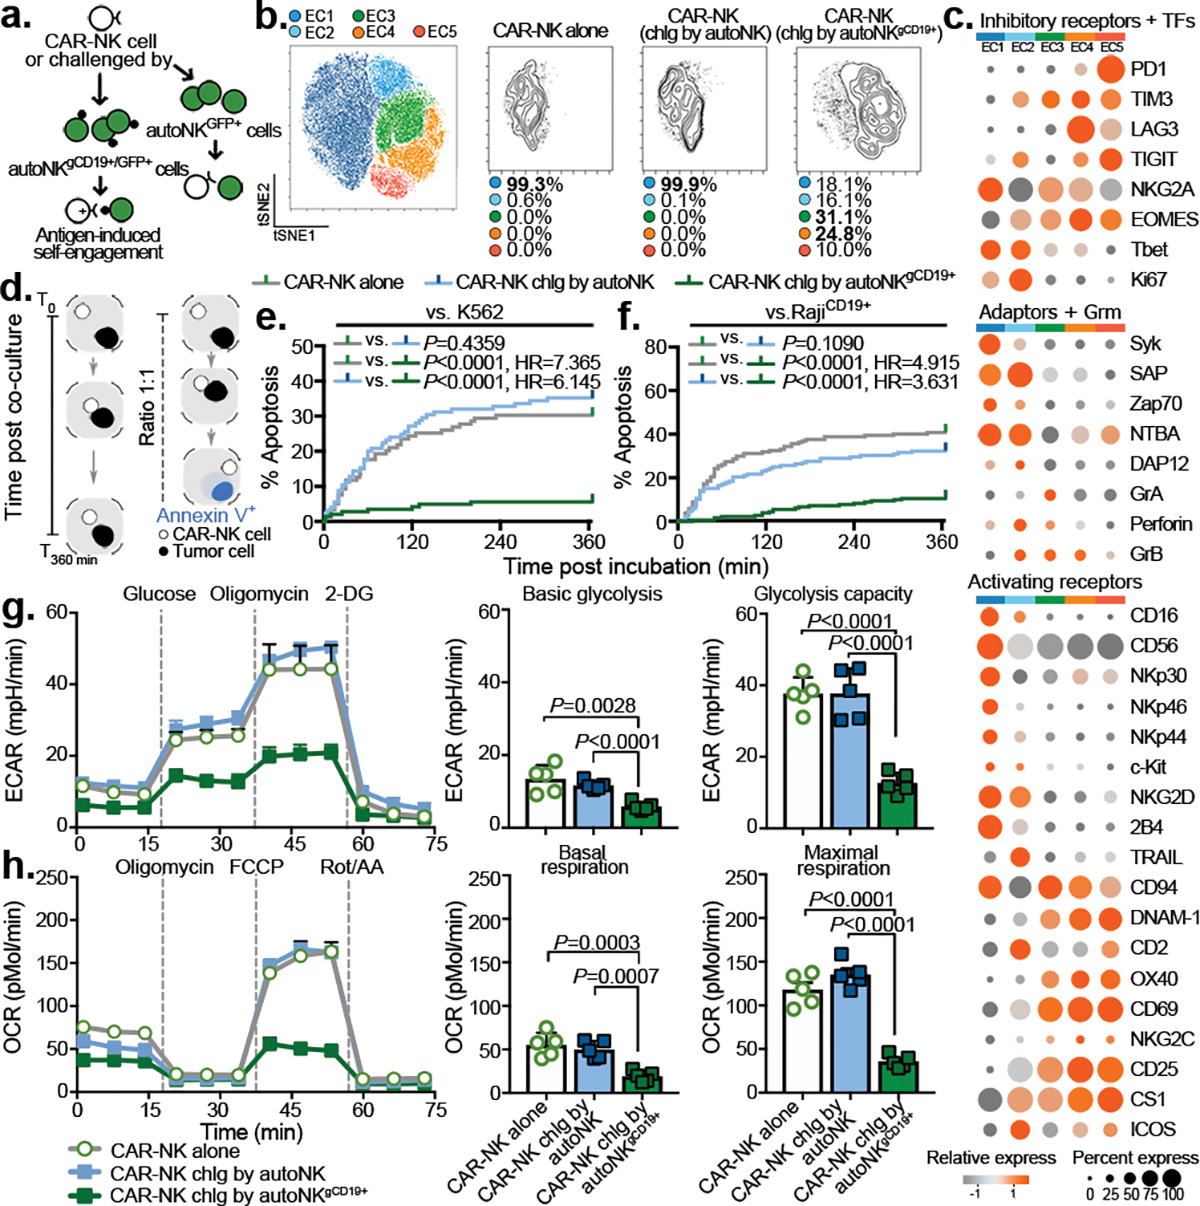
Figure 2. Impact of antigen-induced self-engagement on CAR-NK effector cell phenotype and function.

(a) Schematic illustrating a re-challenge (chlg) assay using autoNKgCD19+ at an E:T ratio of 1:3, controlled by co-culture with autoNK cell (lacking CD19 expression). Both autoNKgCD19+ and autoNK cells were genetically modified to express intracellular GFP to facilitate their identification. (b) tSNE analysis of live NKCAR19+/GFP− cells after the second round of re-challenge with autoNKgCD19+/gGFP+ cells; controls include CAR19-NK cells alone or after 4 days of co-culture with autoNKgGFP+ cells (no CD19 expression). Cells were evaluated by CyTOF, and merged to create a single t-SNE map (10,000 cells from 3 pooled donors per condition). Each cluster (EC1-EC5) is represented in a different color, and frequencies indicated for each culture condition. (c) Heat map for expression of key NK cell phenotypic and functional markers. Expression of each marker is represented by color grey (low) to orange (high) and size of the circle. TFs: transcription factors, Grm: granzyme. (d) Schematic illustrating single-cell time-lapse imaging cytotoxicity assay. Time was recorded over 6 hours (T0 –T360min) for a single CAR-NK cell co-cultured with a single tumor cell. During the incubation, Annexin V influx in the tumor cell was determined as a marker of apoptosis. (e and f) Kaplan-Meier curves showing the percent (%) apoptosis in targeted cells when CAR-NK cells were co-cultured with (e) K562 cells or (f) Raji cells (grey: CAR-NK cells alone; blue: CAR-NK cells isolated after 4 days co-culture with autoNKCD19-/GFP+ cells; green: CAR-NK cells isolated after the second round re-challenge by autoNKgCD19+/GFP+ cells). (g) Ex vivo analysis of CAR-NK cell glycolytic fitness by ECAR (extracellular acidification rate); bar graphs showing their basal ECAR (left; n=5 donors), and their maximum ECAR (right; n=5 donors). (h) Oxidative metabolism (OXPHOS) of CAR-NK cells by OCR (oxygen consumption rate); bar graphs showing their basal OCR (left; n=5 donors), and their maximal OCR (right; n=5 donors).
P values were determined by Log-rank test in panels e and f, or two-sided Student’s t test in panels g and h. Data were shown by mean + s.e.m. Each symbol represents an individual donor-derived CAR-NK cell sample.
