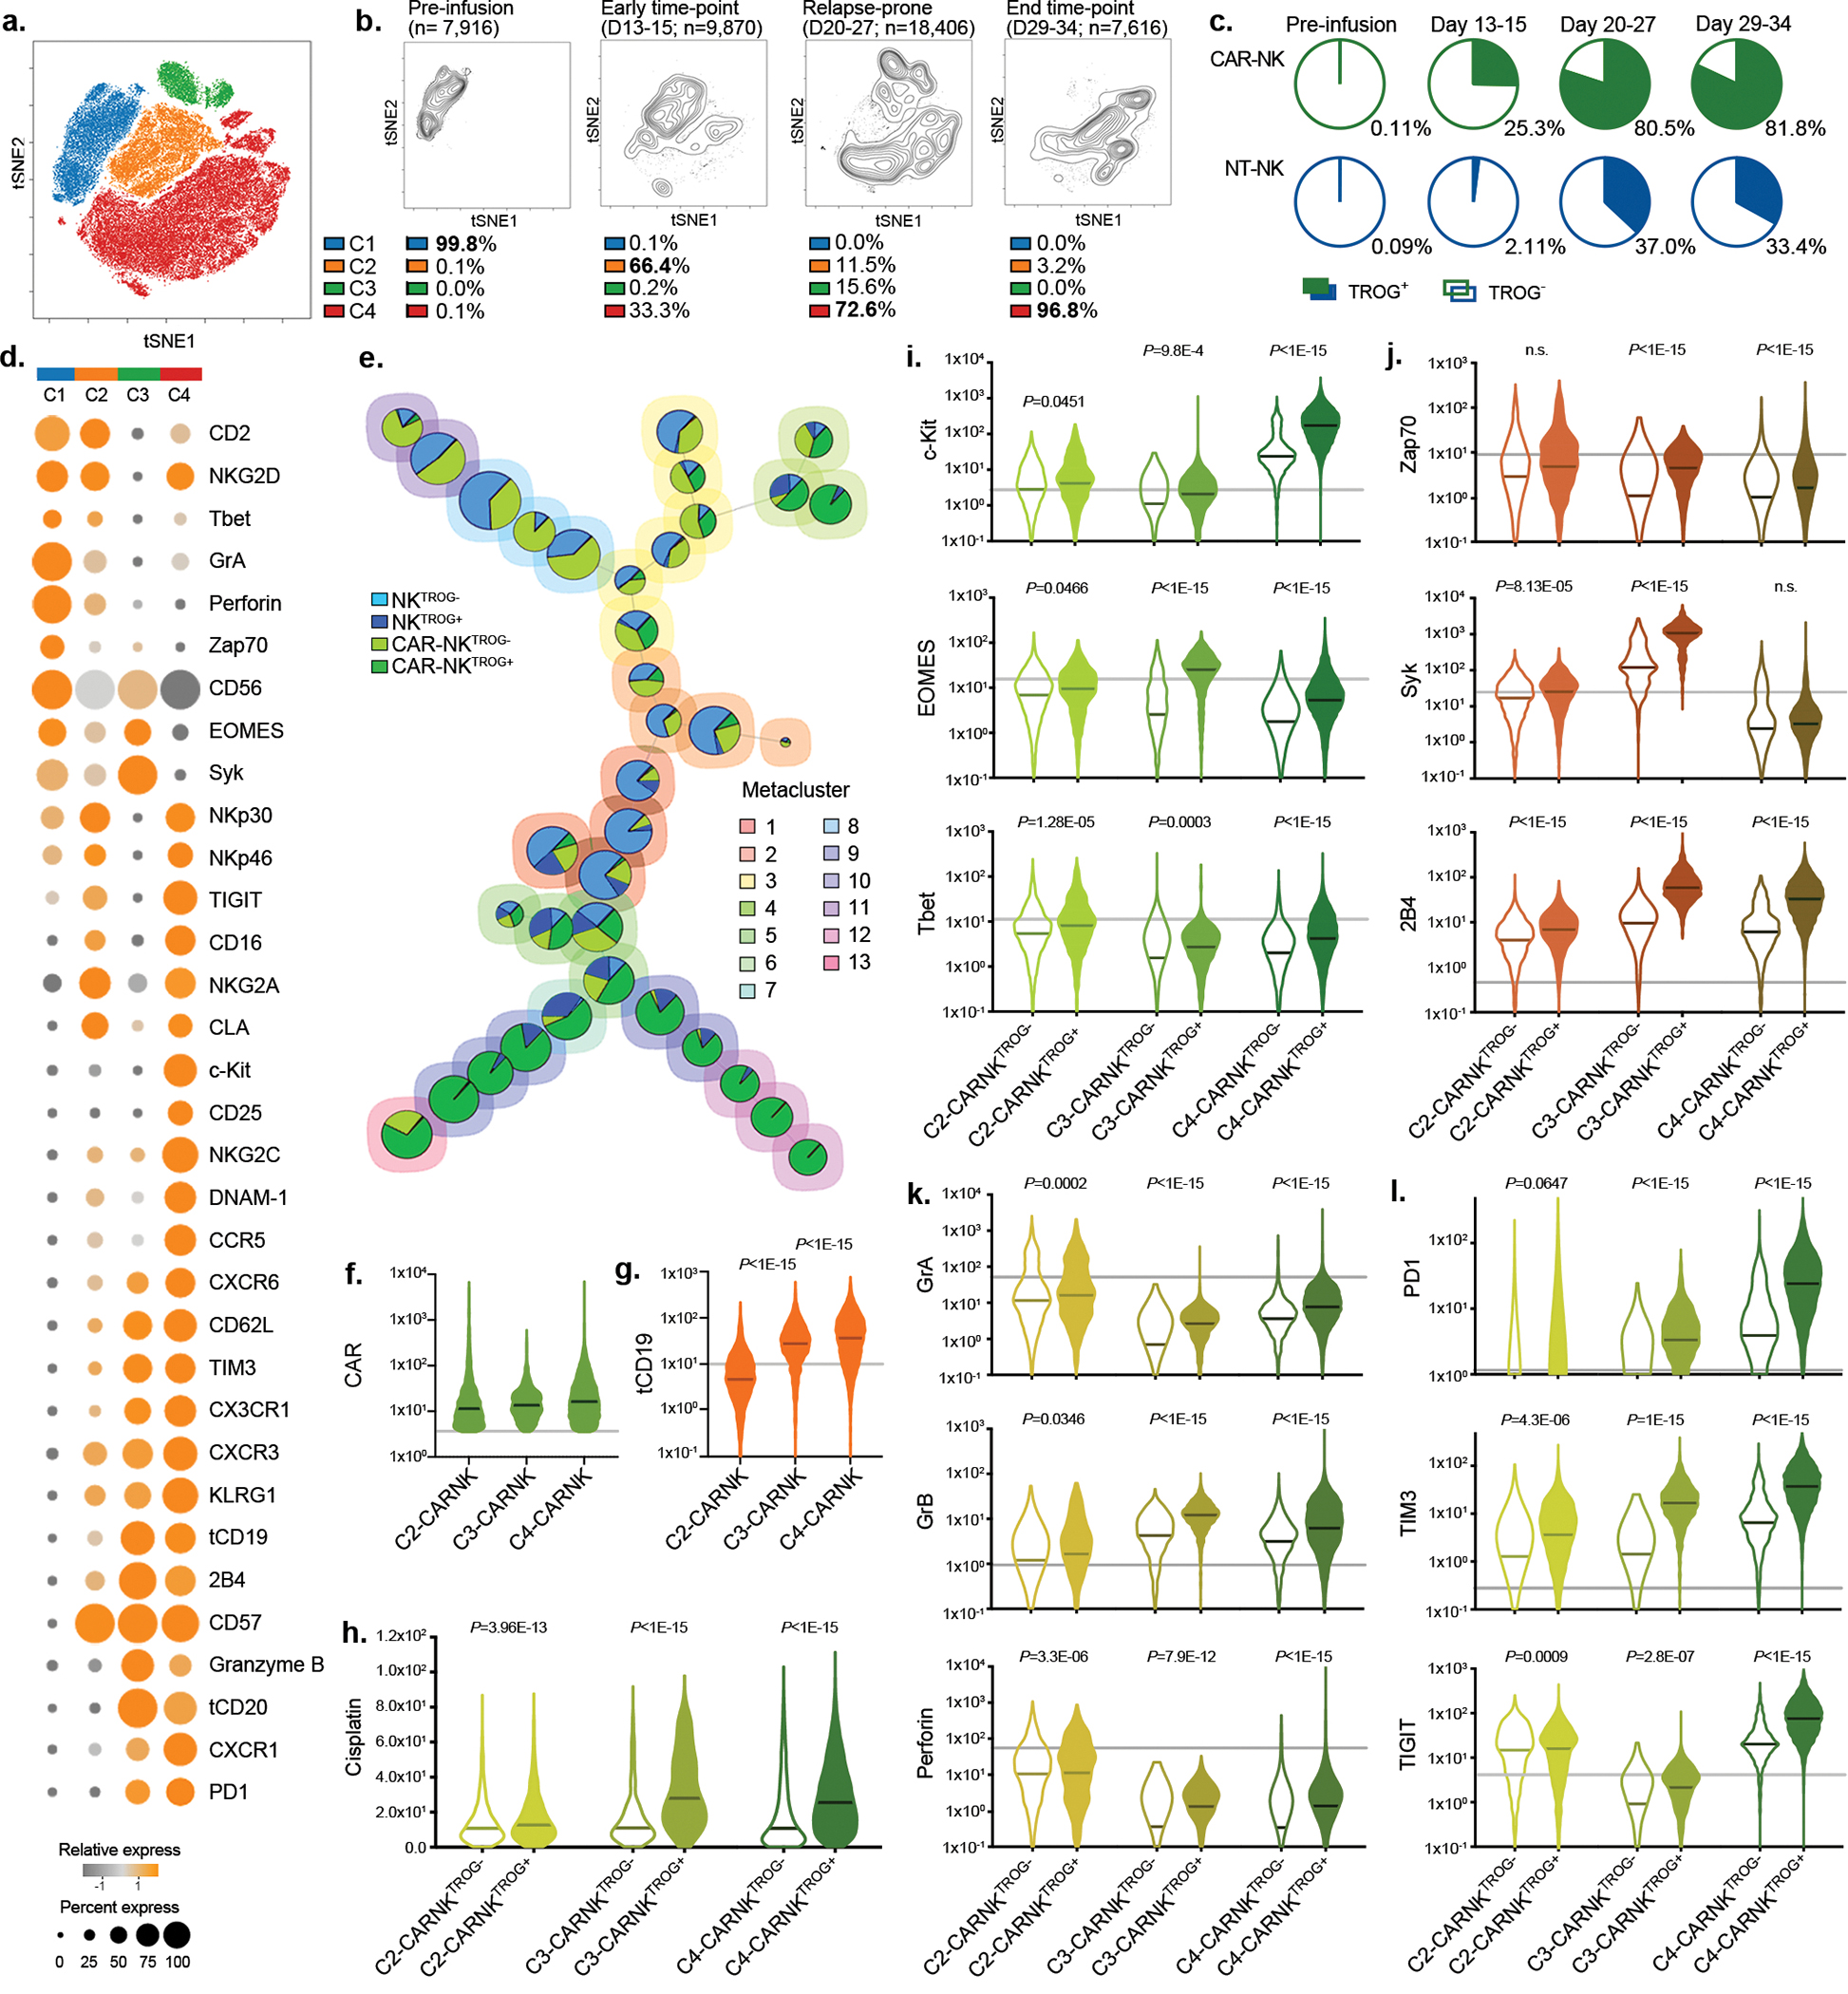
Figure 3. Impact of TROG-antigen acquisition on CAR-NK cell phenotype and function in vivo.

(a) tSNE analysis of live hCD45+GFP−CD56+CD3− NK cells collected from different organs (blood, bone marrow, spleen, and liver) of mice at different points during the treatment course. Phenotypic signatures of all collected NK cells were evaluated by mass cytometry and merged to create a single tSNE map. (b) Contour plots showing the tSNE cluster prevalence in the pre-infusion product, 2 weeks after infusion, 3–4 weeks after infusion, or at the endpoint. The number of cell objects for each condition was indicated. (c) Frequencies of NK cells expressing the TROG-antigen (tCD19) in the CAR19-positive (green) or CAR-negative (blue) fractions at different time points during treatment are presented, controlled by their counterparts in the pre-infusion product. (d) Heat map representing the expression levels of phenotypic and functional markers on CAR-NK cells within each cluster. The expression level for each marker is represented by the color grey (low) - orange (high) and the size. (e) FlowSOM analysis of post-infusion NK cell populations where each metacluster is mapped using a self-organizing mapping strategy. Each colored region corresponds to a metacluster with inserted pie chart representing the frequency of NK cells expressing CAR and TROG-antigen (tCD19) on clustered cells; the size of each chart represents the number of clustered cells. (f and g) Violin plots showing the expression of (f) CAR19, and (g) tCD19 on CAR19-NK cells in each cluster, determined based on their level in pre-infused NT-NK cells shown as the grey line, (h) Violin plot showing cisplatin levels in post-infusion CAR19-NKTROG+ cell (expressing CD19) or their CAR19-NKTROG− counterparts for each cluster. Cisplatin level represents the cellular viability of each population. (i-l) Violin plots showing the expression of (i) c-Kit, EOMES, and Tbet; (j) Zap70, Syk, and 2B4; (k) Granzyme (Gr) A, GrB, and perforin; (l) PD-1, TIM3, and TIGIT in TROG+ and TROG− fractions of CAR19-NK cells. The median expression strength for each marker in CAR19-NK cells prior to infusion (in C1) is indicated by the grey line.
P values were determined by two-tailed Wilcoxon matched pairs test.
