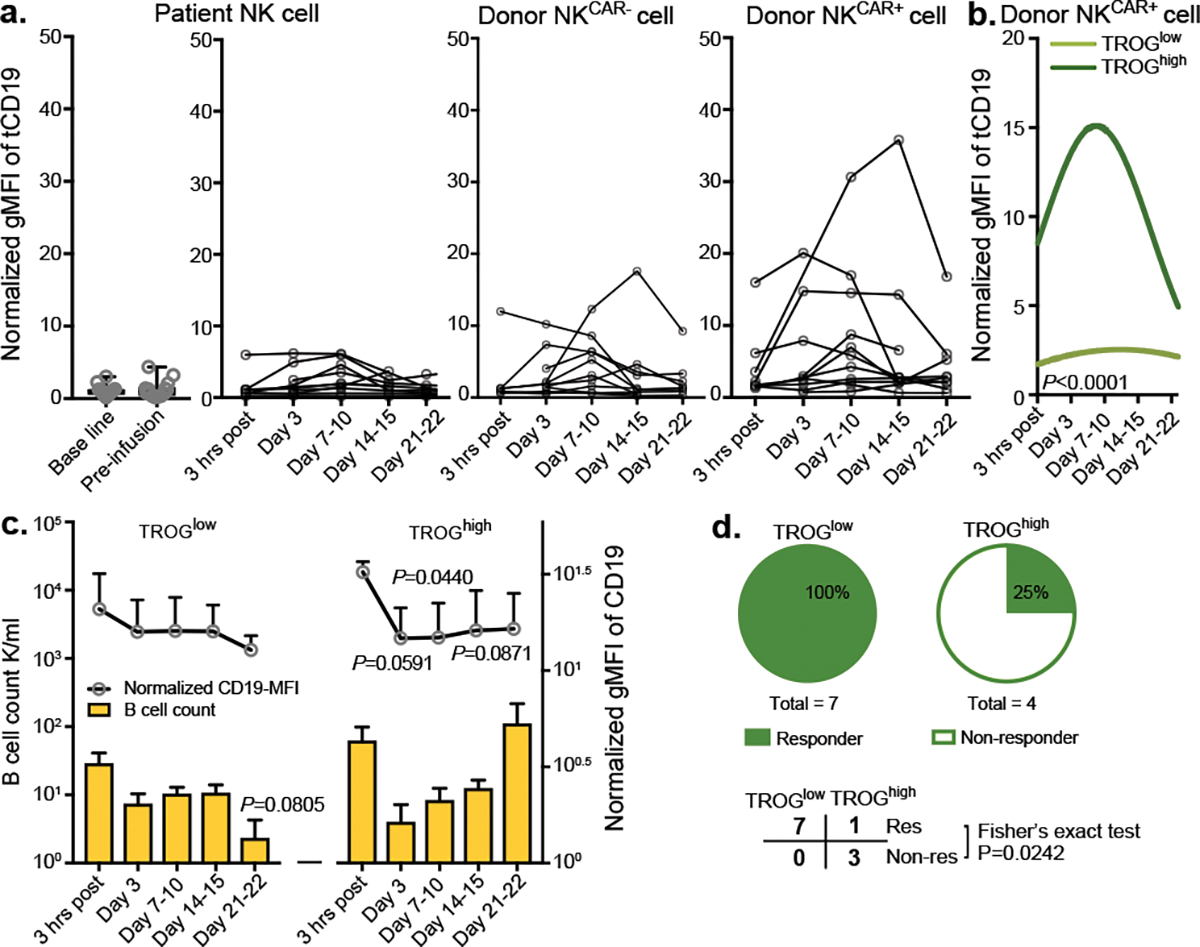
Figure 4. A lower level of CAR-mediated TROG-antigen expression was associated with improved clinical response to CAR-NK cell-based immunotherapy.

(a) tCD19 expression on singlet cells of donor-derived CAR-expressing NK cells (NKCAR+), donor-derived non-CAR expressing NK cells (NKCAR−) and patient-derived NK cells at different time points after receiving CAR19-NK cell immunotherapy. Geometric mean fluorescent intensity (gMFI) of tCD19 expression was assessed by flow cytometry. Samples from individual patients at different times after CAR-NK cell infusion are presented. (b) Non-linear regression analyses using polynomial models show tCD19 expression on donor-derived NKCAR+ cells over time after CAR-NK cell infusion. The normalized mean tCD19 gMFI on CAR19-NK cells for the whole patient population was 6.29 (range of 0.61–35.77). Patients with a high (> mean) versus low (≤ mean) normalized tCD19-gMFI at more than one time point were defined as group of TROGhigh (n=4 patients) vs. TROGlow (n=7 patients), respectively. (c) CD19 expression (upper), and cell counts (lower) for singlet CD19+ B cells in the TROGlow vs. TROGhigh patient groups at different time points after CAR-NK cell infusion. (d) Pie charts showing the number of responders (res, upper) vs. non-responders (non-res, lower) after receiving CAR19-NK cell infusion in the TROGlow vs. TROGhigh groups.
P value was determined by two-tailed two-way ANOVA in panel b, two-sided Student’s t test in panel c, two-tailed Fisher’s exact test in panel d; Data were assessed by mass cytometry and shown by mean + s.e.m. Each circle represents an individual patient.
