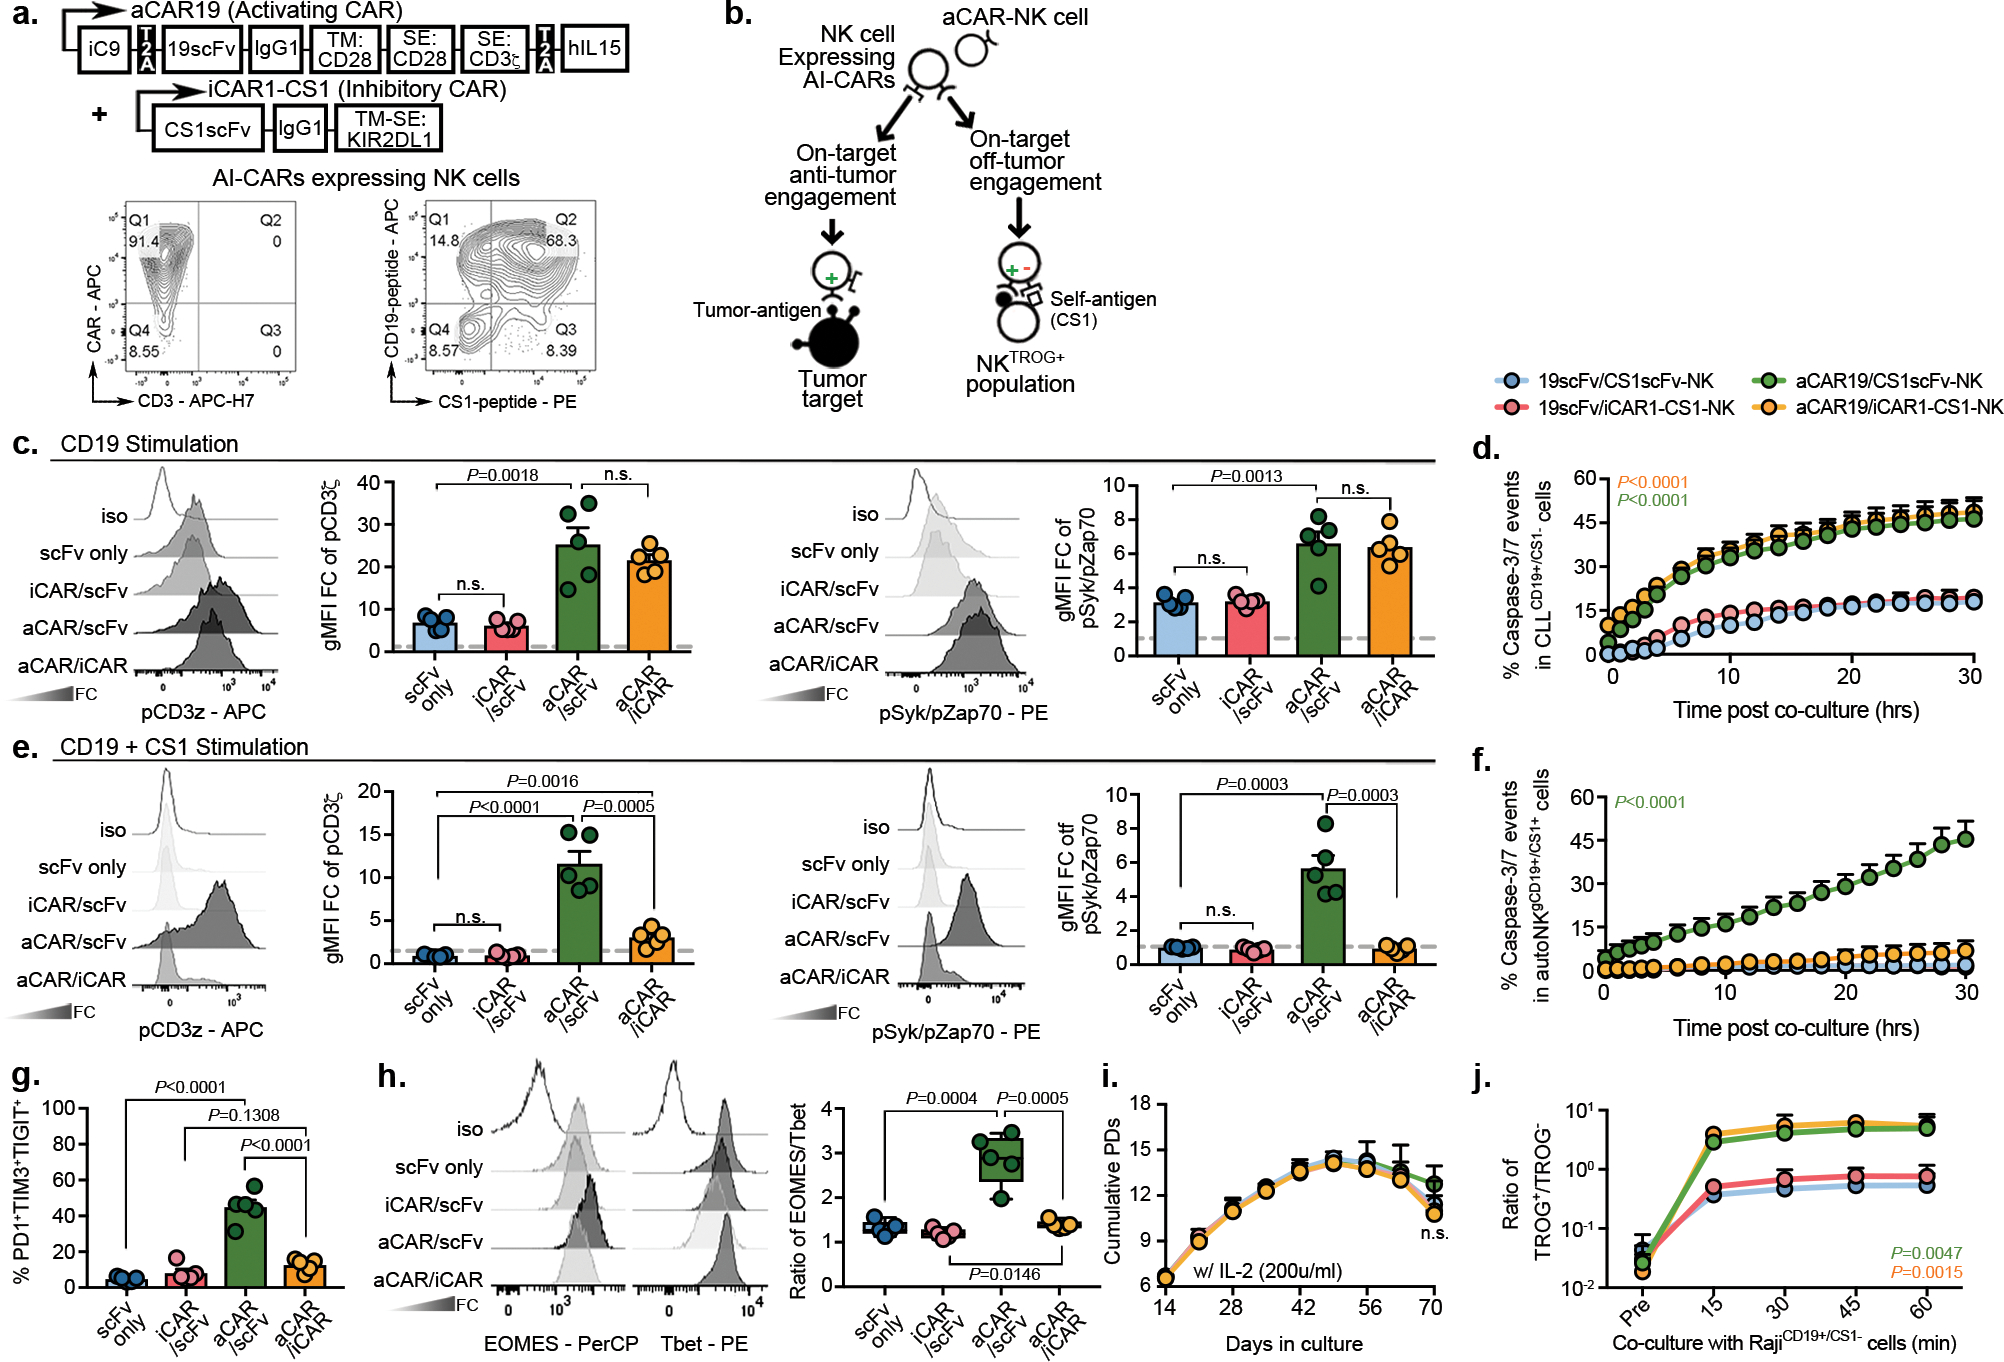
Figure 5. Expression of an iCAR by NK cells reduced fratricide and exhaustion induced by aCAR.

(a) Schematic of the retrovirus vector for aCAR19 and iCAR1-CS1. Flow cytometric analysis shows dual expression of aCAR19 and iCAR1-CS1 on NK cells, measured by tagged peptides (CD19 and CS1). TM: transmembrane; SE: signaling endodomain. CAR expression levels are indicated within respective quadrants. (b) Diagram illustrating engagement of AI-CAR-expressing NK cells with their targets; red symbol indicates inhibitory signal ‘−’, green symbol indicates activating signal ‘+’. (c) Phos-CD3ζ (pCD3z, left) and phos-Syk/Zap70 (right) levels in NK cells expressing 19scFv/CS1scFv (scFv only- no intracellular signaling; blue), 19scFv/iCAR1-CS1 (iCAR/scFv; red), aCAR19/CS1scFv (aCAR/scFv; green), or aCAR19/iCAR1-CS1 (aCAR/iCAR; yellow) after stimulation with RajiCD19+/CS1− cells; the following bar graphs show fold change (FC) in gMFI after normalization to isotype control (n=5 donors/condition). (d) Incucyte analyses showing caspase 3/7 events in CD19+CS1− primary CLL cells after co-culture with CAR-NK cells, controlled by scFv-expressing NK cells (n=3 donors/condition). (e) Phos-CD3ζ (pCD3z, left) and phos-Syk/Zap70 (right) levels in NK cells expressing 19scFv/CS1scFv, 19scFv/iCAR1-CS1, aCAR19/CS1scFv, or aCAR19/iCAR1-CS1 stimulated with CD19+ autoNKCS1+ cells; bar graphs show the FC in gMFI after normalization to isotype control (n=5 donors/condition). (f) Incucyte analysis showing caspase 3/7 events in gCD19+CS1+ autoNK cells after co-culture with CAR-expressing NK cells, controlled by scFv-expressing NK cells (n=3 donors/condition). (g) Co-expression of PD1, TIM3, and TIGIT, and (h) ratio of EOMES/Tbet in singlet CAR-NK cells after the second round of antigen challenge with autoNKgCD19+/CS1+/GFP+ cells (n=5 donors). Representative flow histograms for EOMES and Tbet were shown. (i) Cumulative population doublings (PDs) for each CAR-expressing NK cell condition (n=3 donors) over 70 days of culture with IL-2. (j) tCD19 expression (shown as ratio of TROG+/TROG−) on singlet CAR-expressing NK cells (n=3 donors) after co-culture with Raji cells, controlled by scFv-expressing NK cells (representative of 3 donors).
P values were determined by two-tailed two-way ANOVA in panels d,f,I,j, or two-sided Student’s t test in panels c,e,g,h; n.s: not significant. Data were assessed by flow cytometry in panels a,c,e,g,h,j, and shown as mean + s.e.m, or medium (min/max) in boxplot. Each circle represents an individual donor.
