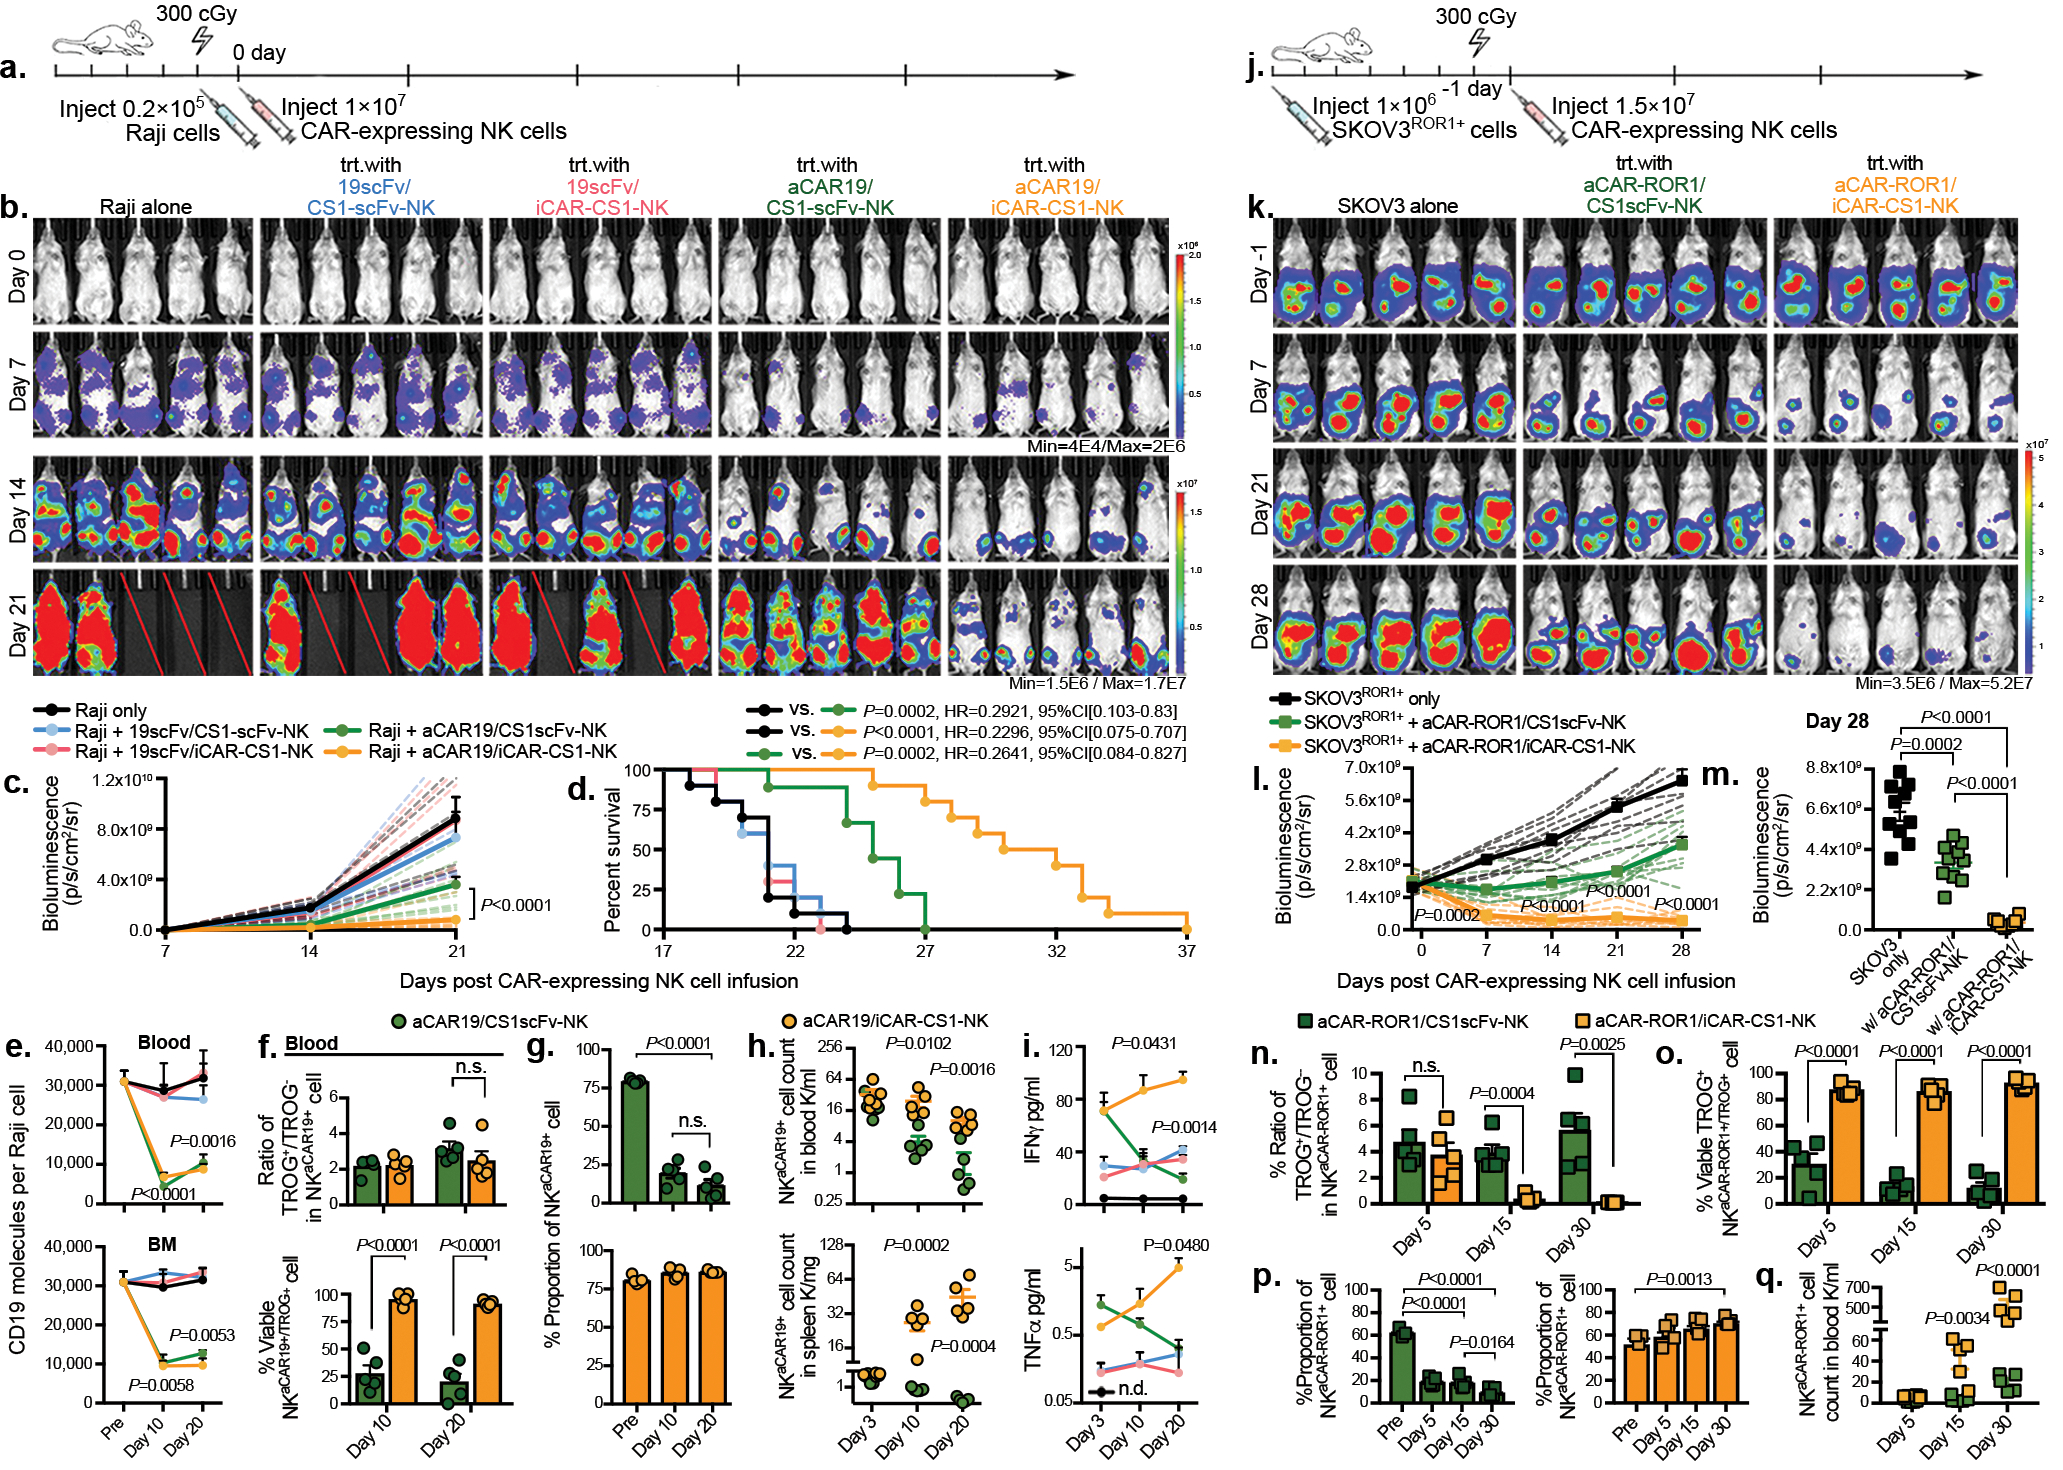
Figure 6. AI-CAR expressing NK cells showed superior in vivo anti-tumor activity.

(a) Schema of the mouse model of Raji tumor. Mice received a single infusion of NK cells expressing 19scFv/CS1scFv (blue), 19scFv/iCAR-CS1 (red), aCAR19/CS1scFv (green), or aCAR19/iCAR-CS1 (orange). trt: treatment, n=5 mice). (b) Tumor burden was assessed weekly by bioluminescence imaging (BLI); and (c) presented as the normalized intensity of BLI; dashed lines refer to each mouse. (d) Kaplan-Meier curves showing survival of mice (e) CD19 expression on Raji cells (molecule count per cell) in peripheral blood (PB) and bone marrow (BM), controlled against tumor only (n=5 mice). (f) tCD19 expression on singlet NKCAR19+ cells, indicated as TROG+/TROG− ratio (left), and viability (%) of TROG+ fraction (NKtCD19+, right) for aCAR19/CS1scFv vs. aCAR19/iCAR-CS1 NK cells, in PB (n=5 mice/group). (g) NK cell viability in PB after aCAR19/iCAR1-CS1 (green bars, left) or aCAR19/CS1scFv NK cell infusion (orange bars, right; n=5 mice/group). (h) Viable NKaCAR19+ cell count in PB and spleen (n=5 mice/group). (i) Serum IFN-γ and TNF-α levels (n=5 mice/group). (j) Schema of SKOV3ROR1+engrafted mouse model receiving a single infusion of NK cells expressing aCAR-ROR1/CS1scFv (green), or aCAR-ROR1/iCAR-CS1 (orange), with non-treated tumor-engrafted group as control (n=5 mice/group). (k-m) Weekly tumor burden assessment by BLI (k); and (l) the normalized BLI intensity for each mouse is indicated by dashed lines, and (m) BLI intensity at day 28. (n) tROR1 expression on singlet NKaCAR-ROR1+ cells (ratio of TROG+/TROG−). (o) Percent viable TROG+ fraction (NKtROR1+) for aCAR-ROR1/CS1scFv (green bar), or aCAR-ROR1/iCAR-CS1 NK cells (orange bar) in PB (n=5 mice/group). (p) Percent viable GFP−CD3−CD56+aCAR-ROR1+ NK cells in PB after aCAR-ROR1/CS1scFv (green bar, left) or aCAR-ROR1/iCAR-CS1 NK cell infusion (orange bar, right; n=5 mice/group). (q) Viable NKaCAR-ROR1+ cell count in PB after aCAR-ROR1/CS1scFv (green symbols), or aCAR-ROR1/iCAR-CS1 cell infusion (orange symbols; n=5 mice per group).
P values were determined by two-tailed two-way ANOVA in panel c, Log-rank test in panel d, or two-tailed Student’s t test in panels e,f,g,h,i,l,m,n,o,p,q. Data were pooled from two independent experiments using NK cells from different donors in panels c,d,i m. Flow cytometry data are shown as mean + s.e.m. Each symbol represents an individual mouse sample.
