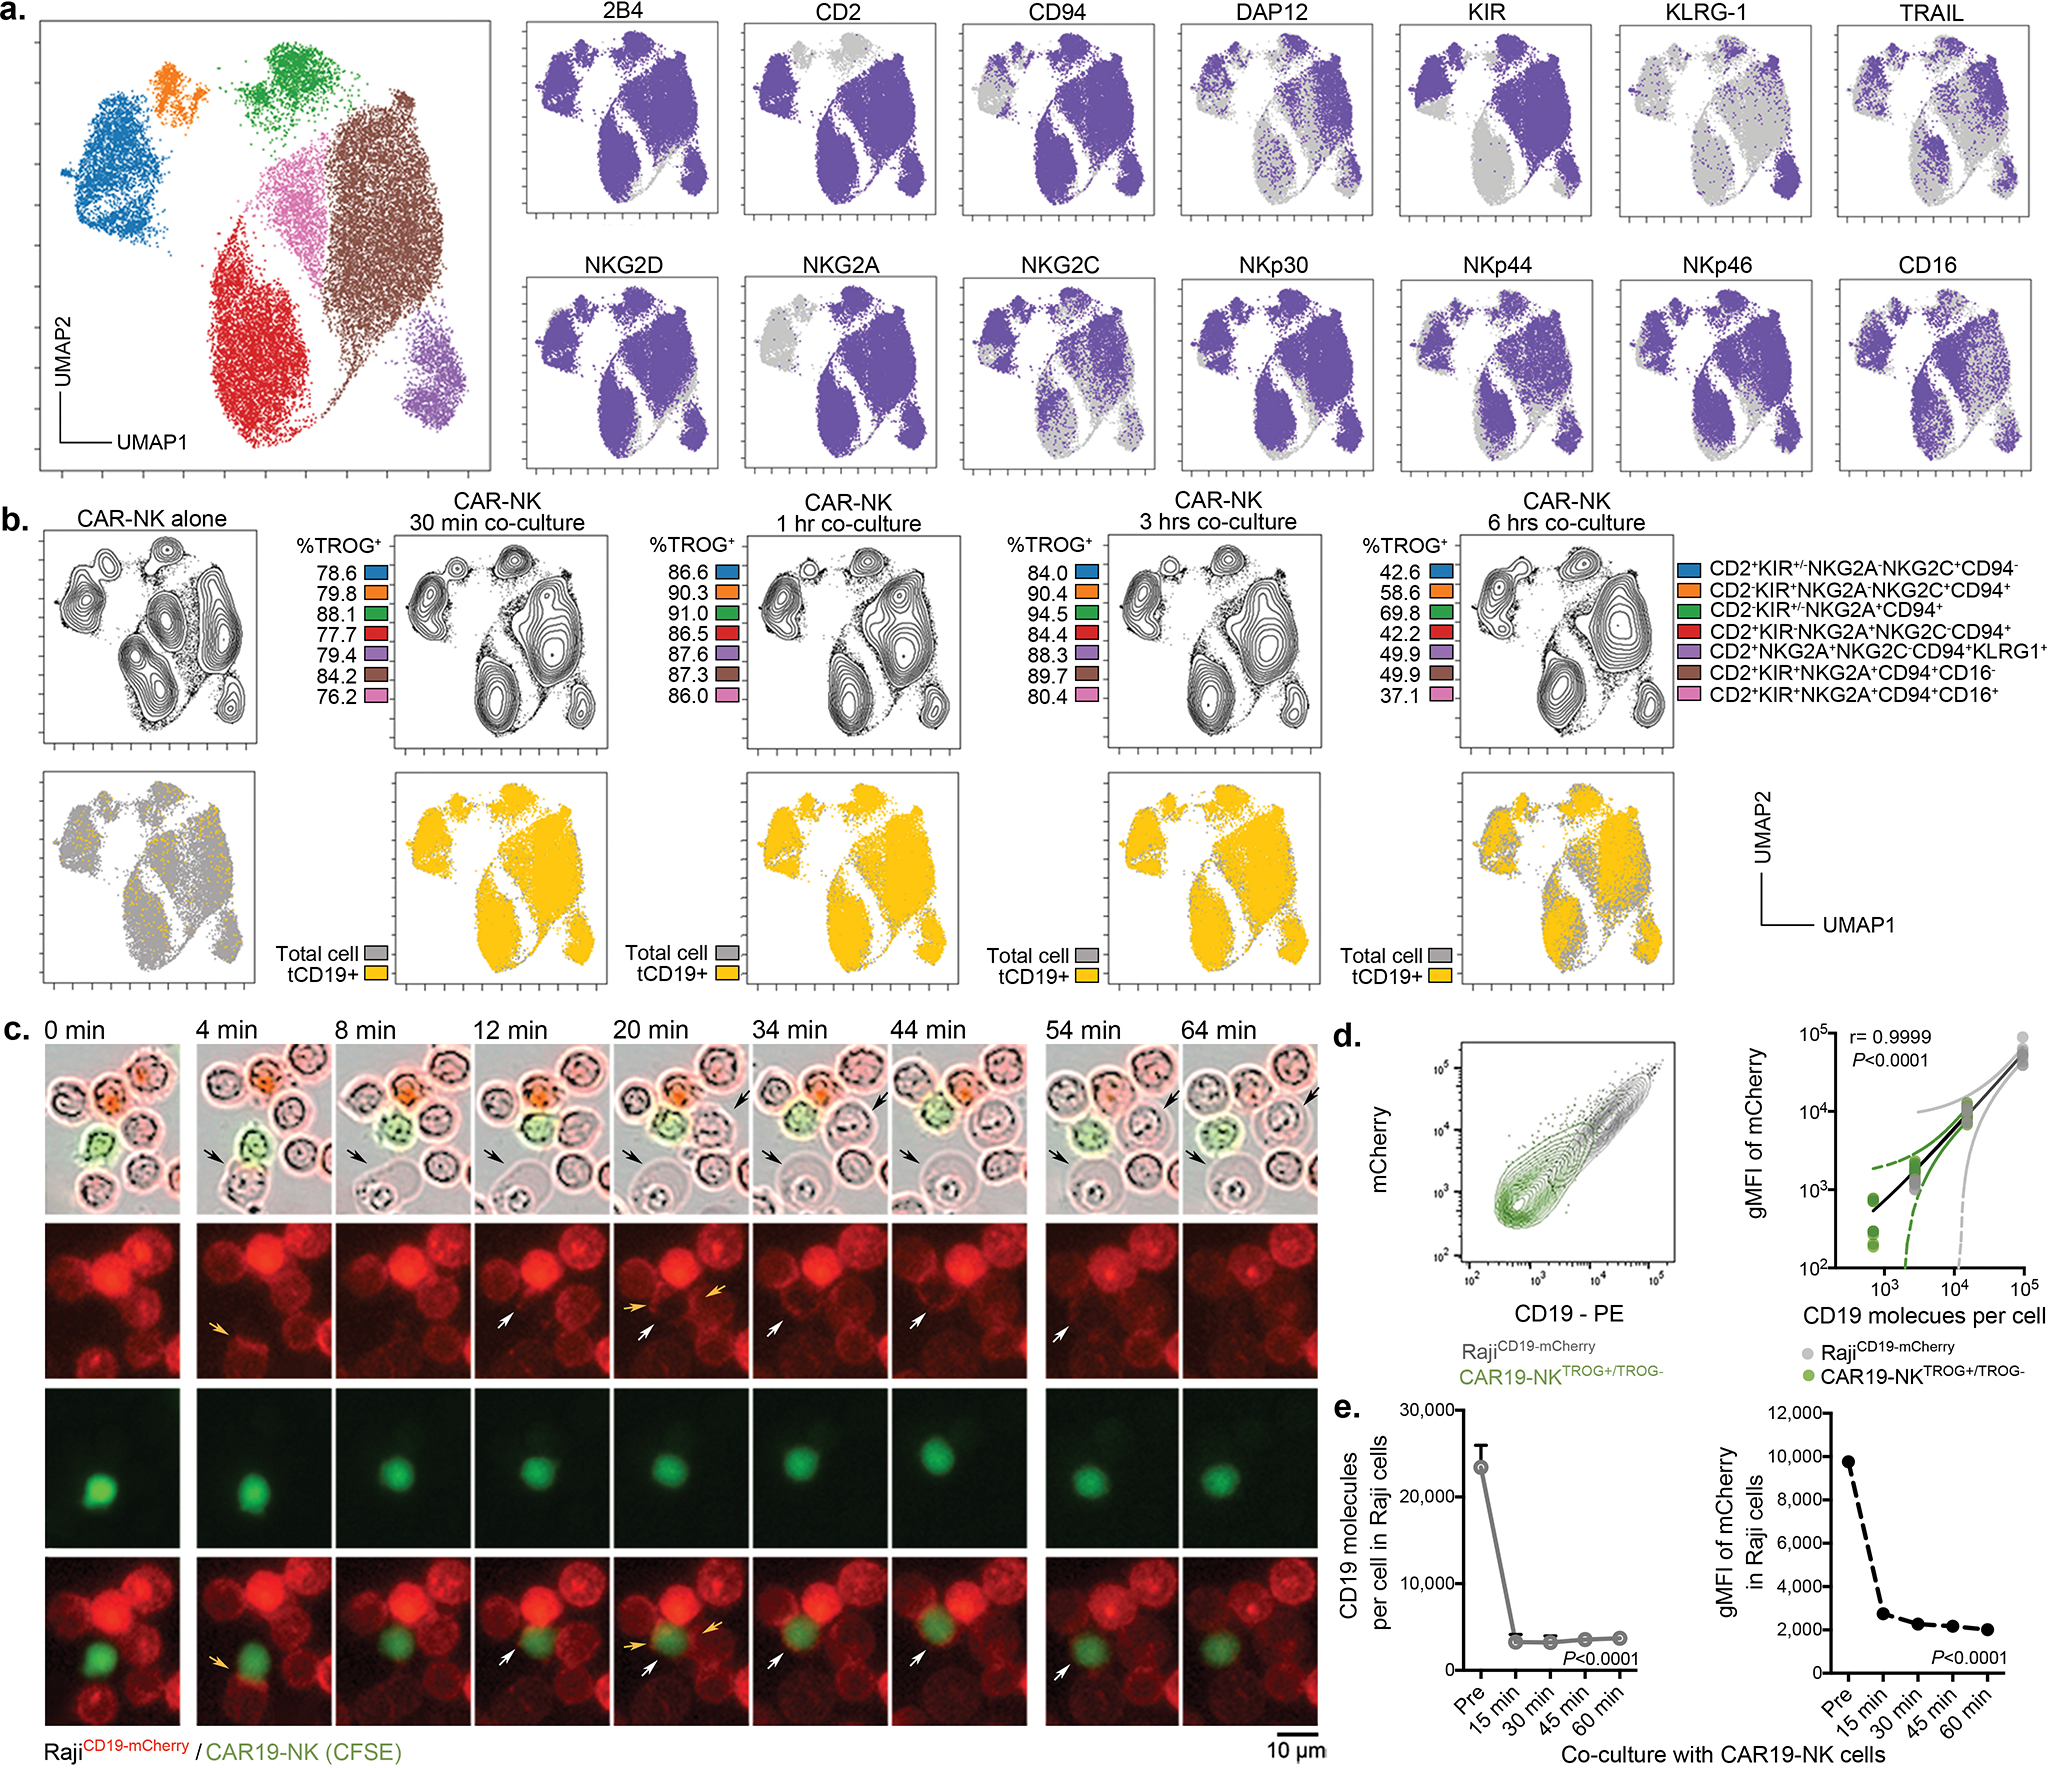
Extended Data Fig. 2. CAR19-mediated acquisition of tCD19 on NK cells from targeted Raji cells was associated with decreased anti-tumor cytotoxicity.

(a) UMAP analyses of CAR-NK cells collected after co-culture with RajiCD19+ cells. Phenotypic signatures of all collected CAR-NK cells were evaluated by mass cytometry, and data from 10,000 cells derived from 3 donors were merged to create a single UMAP map, where the analysis generated eight distinct color-coded clusters that represented the different subsets of NK cells. Marker expression for each NK cell subset was shown in UMAP plots. (b) Contour plots showing the UMAP cluster prevalence of CAR-NK cells alone, 30 min, 1 hr, 3 hrs, or 6 hrs after co-culture with Raji cells. The percentage of TROG+ CAR-NK cells (upper panel), and tCD19 expression are presented for each subset for the different conditions (lower panel). (c) Real-time images representing the co-culture of CAR19-NK cells (green) with RajiCD19-mCherry cells (red). Black arrows indicate events of cell apoptosis; yellow arrows indicate the immunologic synapse-like structure; white arrows indicate CAR19-NK cells with evidence of mCherry transfer; scale bar indicates 10 μm. (d) Flow cytometric analyses represent co-expression of CD19 and mCherry on singlet RajiCD19-mCherry cells cultured either alone (grey, representative for 3 samples) or CAR19-NK cells after co-culture with RajiCD19-mCherry cells for 5 mins only (green, representative for 5 donors); the following graph shows the correlation between mCherry (as determined as gMFI) and CD19 (as determined as the number of molecules per cell) for each singlet cell. (e) CD19 (as determined as the number of molecules per cell), and gMFI of mCherry expression on singlet RajiCD19-mCherry cells at different time points during co-culture with CAR19-NK cells (n=3 donors).
P values were determined by two-tailed Pearson’s correlation coefficient in panel d, two-tailed one-way ANOVA in panel e. Data were assessed by flow cytometry in panels d and e, and shown by mean + s.e.m.
