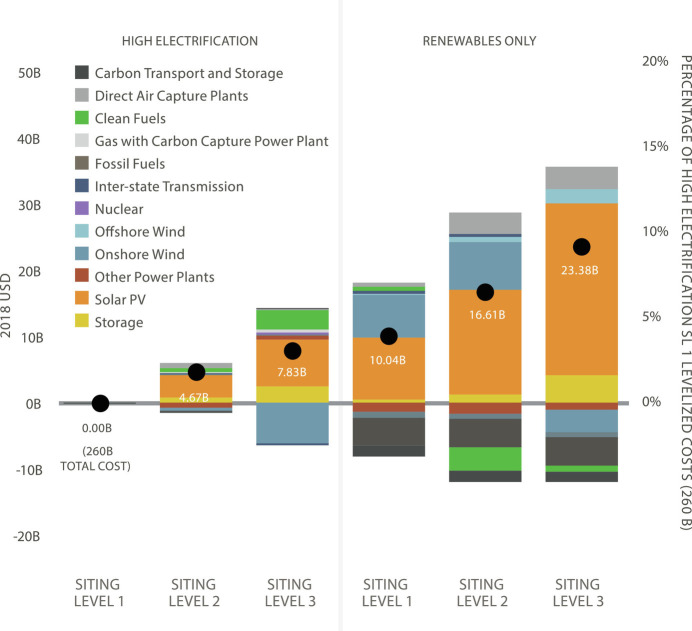
Fig. 4.
Net annual levelized supply-side cost in 2050 for scenarios is shown relative to the High Electrification Siting Level 1 scenario. Bars above the x-axis represent an increase in costs, while bars below represent a decrease in relative cost. Labeled points provide the net cost. The secondary y-axis shows the percentage cost increases compared with the High Electrification SL1 scenario, which costs 260 billion USD.

