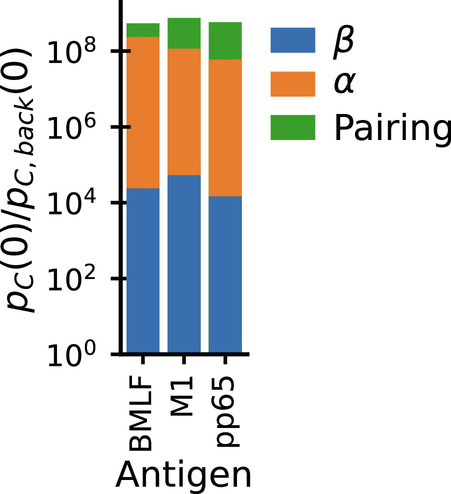
Fig. 4.

Epitope binding restricts diversity of both chains individually and also restricts their pairing. Bar chart shows the decomposition of paired chain exact coincidence probability ratios (Fig. 3A) for individual epitopes in the dataset from Dash et al. (14) into contributions from selection of α chains (Fig. 3D) and β (Fig. 3F) individually (blue, orange), plus a smaller contribution from restricting the pairing of the two chains (green).
