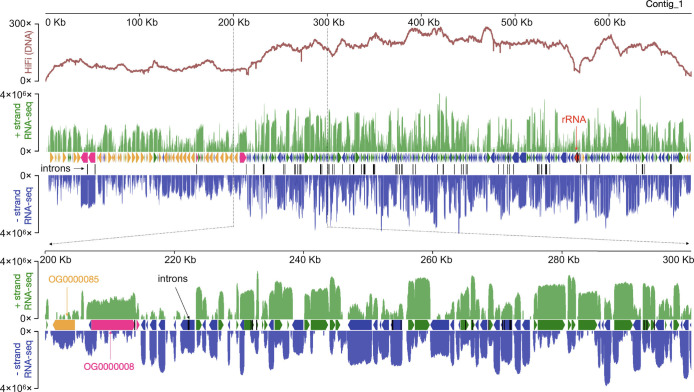
Fig. 3.
Gene-dense somatic genome. HiFi (DNA) and RNA-seq coverage across a representative B. stoltei ATCC 30299 MAC genome contig (Contig_1). Y scale is linear for HiFi reads and logarithmic (base 10) for RNA-seq. Plus strand (relative to the contig) RNA-seq coverage is green; minus strand RNA-seq coverage is blue. Between the RNA-seq coverage graphs, each horizontal arrow represents a predicted gene. Two orthogroups classified by OrthoFinder are shown.

