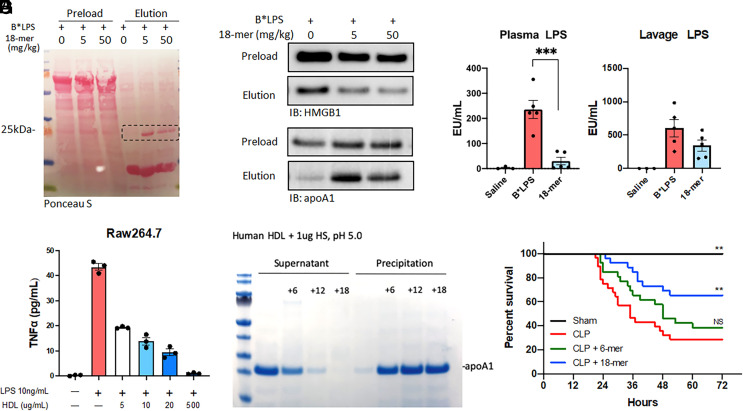
Fig. 3.
18-mer enlists ApoA-I to reduce inflammation and exert a protective effect against sepsis. (A–D) Plasma and peritoneal lavage were collected from mice 2 h after B*LPS administration (i.p., 5 mg/kg) with or without the indicated concentration of HS (n = 4 to 7). (A) The SDS-PAGE image of the peritoneal lavage stained with Ponceau S. The membrane is the same as Fig. 2E. The protein migrated at 25 kDa was identified as ApoA-I by proteomic analysis. (B) Immunoblot of the level of B*LPS/HMGB1 (Top) and B*LPS/ApoA-I (Bottom) from peritoneal lavage. Samples before and after affinity purification by streptavidin resin are labeled “preload” and “elution,” respectively. The full image is presented in SI Appendix, Fig. S15. (C, D) The concentration of LPS in the plasma and peritoneal lavage (n = 4 to 7). Data expressed as mean ± SEM and analyzed by one-way ANOVA followed by Dunnett’s multiple comparison test. ***P < 0.001(E) The protein level of TNF-a from the cell supernatant of LPS-stimulated Raw264.7, with or without HDL pretreatment (n = 3). (F) The dissociation of human HDL by HS oligosaccharides. Human HDL (200 mg/mL) was incubated with 6-mer, 12-mer, and 18-mer (5 mg/mL) under mildly acidic conditions and centrifuged. The supernatant and precipitation from each reaction were analyzed by SDS-PAGE followed by Coomassie blue staining. (G) The 72-h survival in CLP mice was administered (S.Q.) with saline, 6-mer, and 18-mer at 0, 6, 12, 24, 36, and 52 h. (sham, n=8 male; CLP, n=22 male and 6 female; CLP + 18-mer, n = 20 male and 6 female, CLP + 6-mer, n = 20 male and 6 female). Data analyzed by log-rank test; overall, P = 0.0006; CLP vs. Sham, P = 0.0019; CLP vs. CLP + 18-mer, P = 0.0015; CLP vs. CLP + 6-mer, P = 0.2040. Survival data were individually presented for male and female groups in SI Appendix, Fig. S11.

