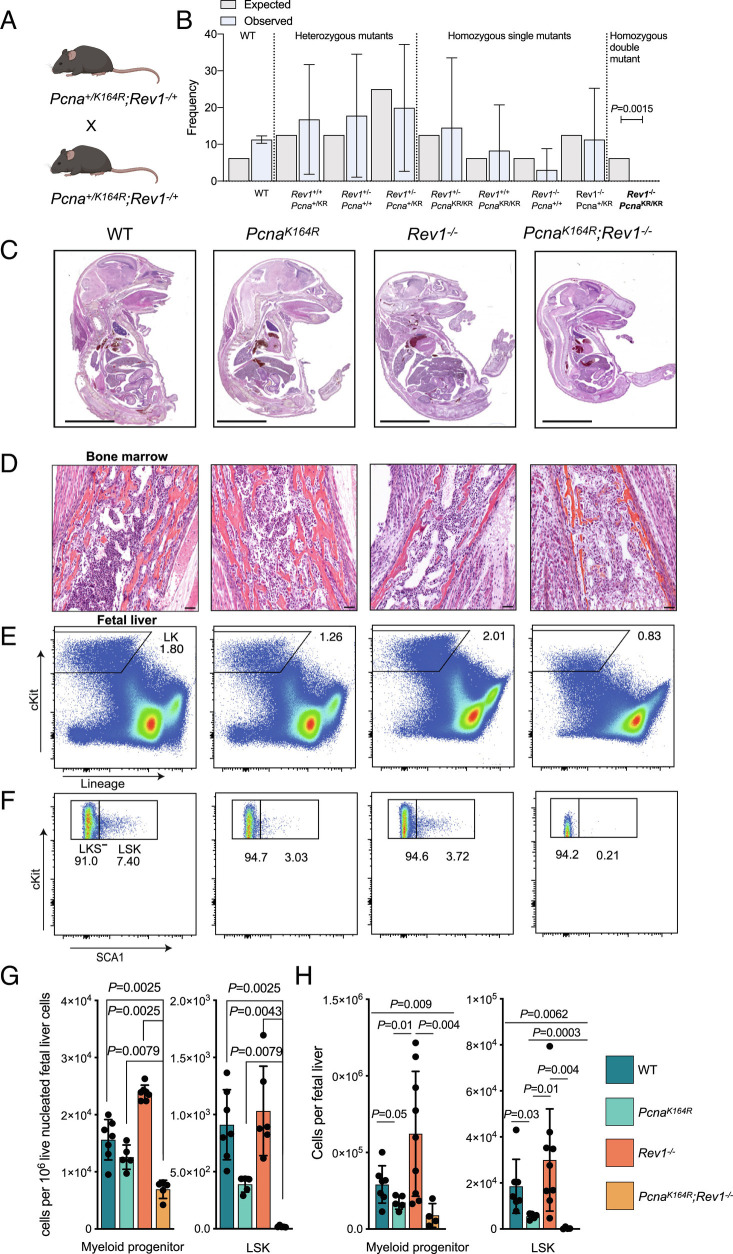
Fig. 1.
Absence of DDT results in embryonic lethality and severe hematopoietic stem cell failure. A, Breeding scheme to obtain DM embryos and mice. B, Observed and expected frequencies of offspring, obtained from PcnaK164R/+Rev1+/− intercrosses (Fisher’s exact test, 95% CI, n = 166, from 26 breeding pairs). C, Representative sagittal sections of WT, SMs, and PcnaKR Rev1−/− genotypes at E18.5. (Scale bar, 5 mm.) D, Microphotographs of H&E sections of BM from WT and PcnaK164R Rev1−/− E18.5. The PcnaK164R Rev1−/− BM showed the absence of hematopoietic cells which were replaced by stromal cells. Furthermore, the controls did show the presence of numerous dark-blue myeloid cells. (Scale bars, 50 µm.) E and F, Gating strategy and representative frequencies of Lin−cKit+ cells, myeloid progenitors (LKS−) and LSK of FL from WT and PcnaK164R Rev1−/− E18.5 embryos. G and H, Relative (G) and absolute (H) numbers of the defined hematopoietic subsets in E and F. In each graph, the bar represents the mean ± SD. WT n = 7, PcnaK164R n= 5, Rev1−/− n = 6, PcnaK164R Rev1−/− n= 5. Same in G and H but in H, the n for Rev1−/− is 9. The graphs indicate specific cells counts per 10−6 of live FL cells. P values were calculated using unpaired t test with Welch’s correction.

