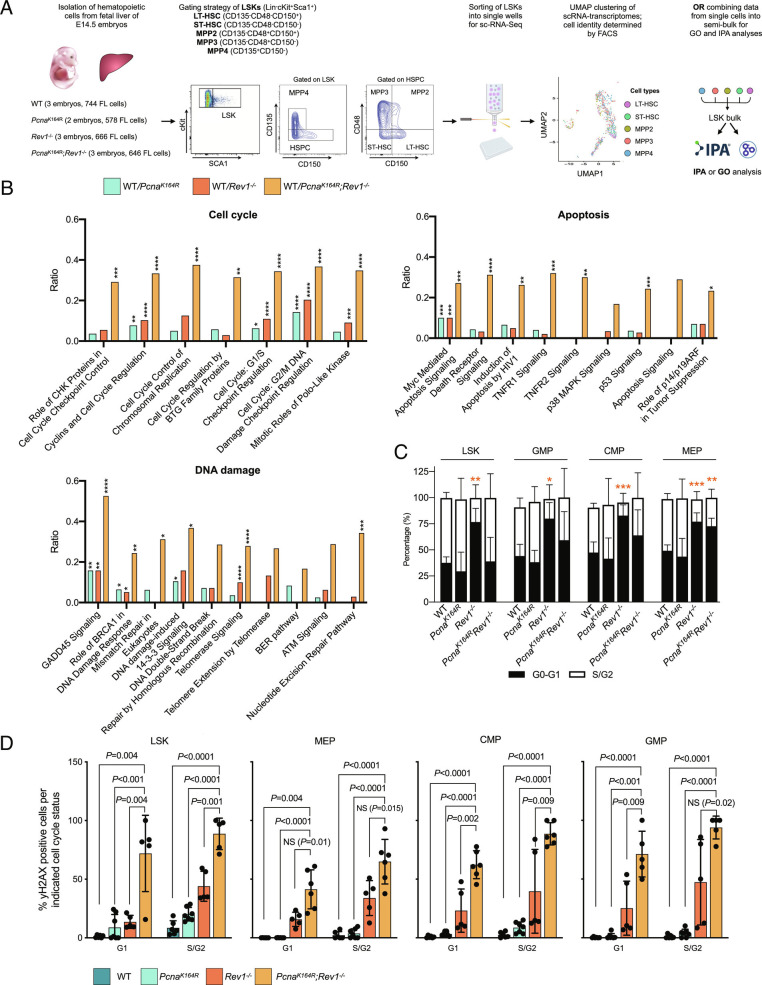
Fig. 2.
DDT deficiency results in DNA damage, apoptosis and cell cycle checkpoint activation in HSPCs. A, Analysis of transcriptomes by the SORT-Seq approach: FLs were isolated from E14.5 embryos, and LT-HSC, ST-HSC, and MPP2-4 cells from the LSK compartment were sorted into single wells, followed by scRNA-seq, allowing for downstream matching of the transcriptome with each cell type. For some analyses in this figure, transcriptomes from single cells were pooled into a semi-bulk, allowing for IPA analysis. B, Histogram representing the ratio between the number of DE genes associated with the cell cycle divided by total number of genes in cell cycle genes, enriched in each mutant compared to the WT as identified by IPA. The analysis for other graphs was the same, but here, the IPA identified DNA damage pathways, and senescence and cell death pathways were used. P values calculated using a right-tailed Fisher’s exact test with a Benjamini–Hochberg correction for multiple testing. C, Cell cycle state as analyzed by DAPI staining in LSK and myeloid progenitor cells from E18.5 FLs. P values calculated using unpaired t test with Welch’s correction. D, Percentage of γH2AX positive HSPCs in G1 and S/G2 of the cell cycle. The columns represent the mean ± SD. WT n = 6, PcnaK164R n= 7, Rev1−/− n = 5, PcnaK164R Rev1−/− n= 5. P values calculated using unpaired t test with Welch’s correction.

