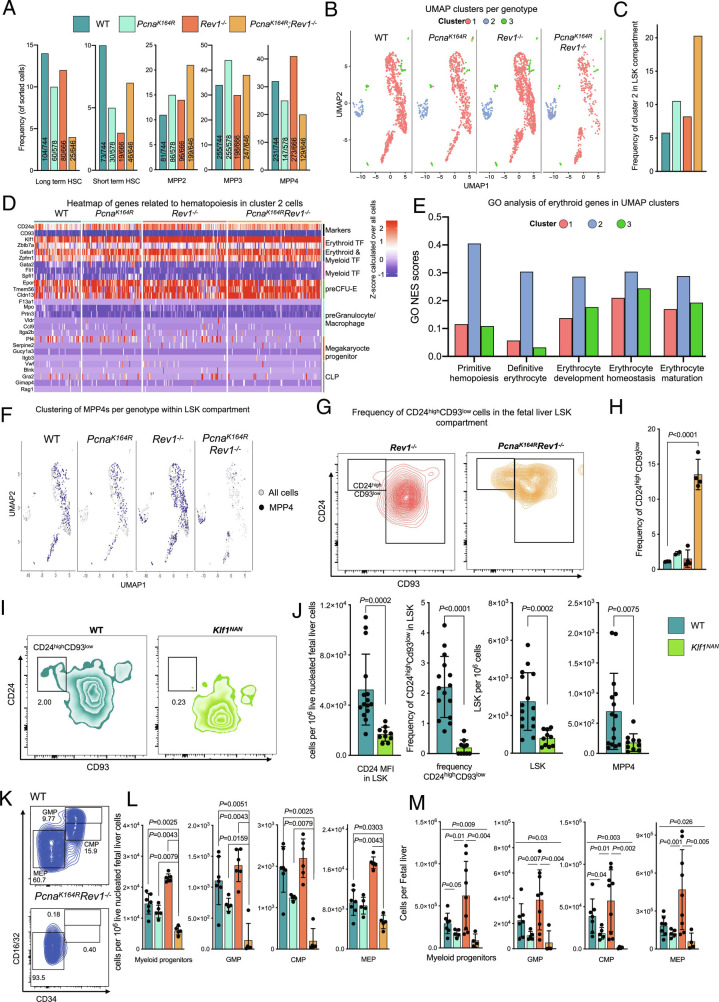
Fig. 3.
Erythroid cells present in LSKs and myeloid progenitors selectively remain in DM embryos. A, Percentages and numbers of indicated cell subsets sorted for SORT-Seq within the E14.5 LSK compartment. B, Single-cell transcriptome-based UMAP clustering of indicated genotypes. Color-coded cells correspond to indicated clusters. C, Quantification of the frequency of cells belonging to cluster 2 in each genotype, as determined by the SEURAT algorithm. D, Heatmap of handpicked genes related to differentiation of MEPs, CLPs, GMPs as well as depiction of marker genes of cluster 2 per genotype. E, GO analysis of differential genes of cluster 2 compared to the clusters, error bars denote GO scores of clusters from all embryos combined (total n = 11). F, Residence of MPP4s in each cluster, shown as the UMAP plots of SORT-Seq. Note the increased residence of MPP4s in cluster 2 in Rev1-/- and DM embryos. G, FACS representative example of CD24high CD93low population in Rev1−/− and DM FL LSKs. H, Frequency of CD24high CD93low population by flow cytometry in FL LSKs. I, FACS gating of LSKs, containing CD24ahighCD93low subset in WT and Klf1NAN E18.5 embryos. J, In each graph, the bar represents the mean ± SD. WT n = 15, Klf1NAN = 10. Quantification of CD24 MFI of LSK cells (Left) and frequency of CD24ahighCD93low population in WT and NAN E18.5 (Middle). The graphs on the right indicate specific cells counts per 1 × 10⁻⁶ of live cells. P values were calculated using unpaired t test with Welch correction. K, Composition of the myeloid compartment in WT and DM embryos. L and M, Relative (L) and absolute (M) numbers of indicated myeloid compartment cells. In each graph, the bar represents the mean ± SD. n for L: WT n = 7, PcnaK164R n= 5, Rev1−/− n = 6, PcnaK164R Rev1−/− n= 5. n for M: WT n = 7, PcnaK164R n= 5, Rev1−/− n = 9, PcnaK164R Rev1−/− n= 4. P values were calculated using unpaired t test with Welch’s correction.

