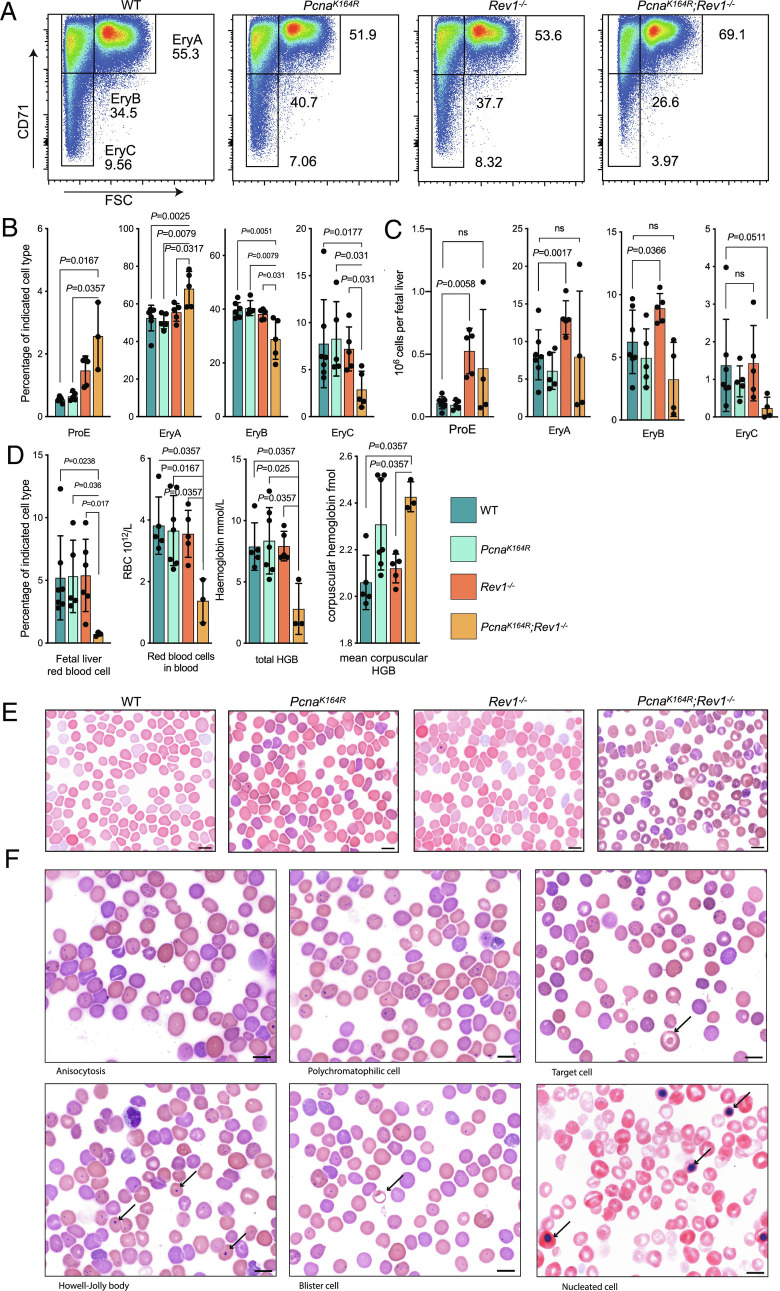
Fig. 4.
DM embryos feature stressed erythropoeiesis and suffer from severe anemia. A, Gating strategy of EryA-C erythroid cells from E18.5 PcnaK164R Rev1−/− and control FLs. B and C, Blood cell maturation percentages (B) and absolute numbers (C) in FLs of PcnaK164R Rev1−/− embryos. Central line represents the mean ± SD. WT n = 7, PcnaK164R n= 5, Rev1−/− n = 5, PcnaK164R Rev1−/− n= 3. P values were calculated using Mann–Whitney U test. D, Frequency of erythrocytes in the FL, RBC count, and hemoglobin levels of RBCs. Central line represents the mean ± SD. WT n = 5, PcnaK164R n= 7, Rev1−/− n = 5, PcnaK164R Rev1−/− n= 3. P values were calculated using Mann–Whitney U test. E, Wright–Giemsa’s blood films of DMs, SMs and controls. DMs show signs of severe anemia. (Scale bar, 10 µm.) F, Microphotographs examples of Wright–Giemsa’s blood films of DM E18.5 embryos. Examples of anemic phenotype consist of: anisocytosis (variation in cell size: a mixed population of microcytes and macrocytes), polychromasia (reticulocytes), target cell (arrow), nucleated RBC (arrows), cells with basophilic inclusion body, blister cell (arrow), and Howell-Jolly bodies. (Scale bars, 10 mm.)

