Fig. 2.
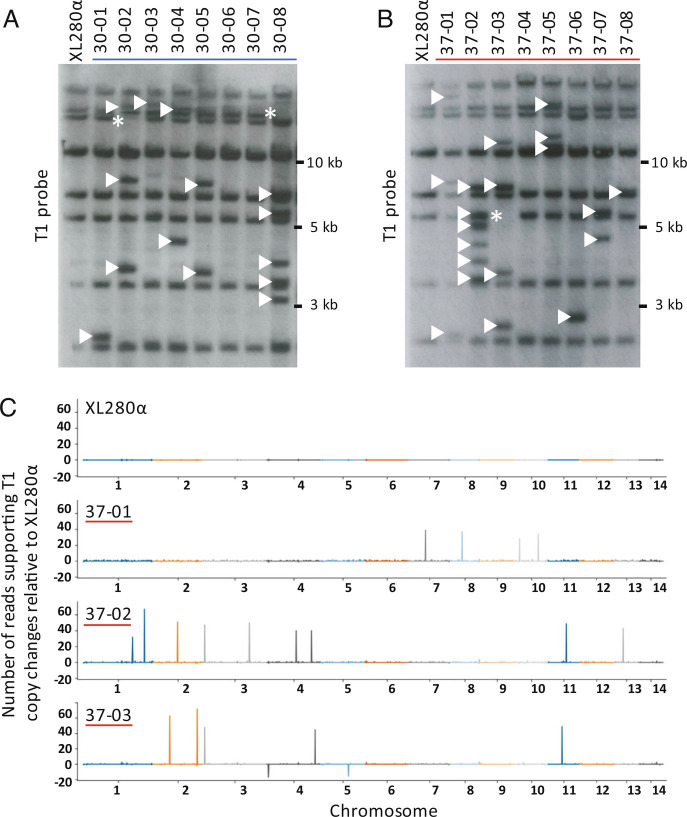
Mapping of TE changes in XL280α TA lines passaged ~800 generations. (A) Southern analysis of BspEI-digested genomic DNA probed for T1 (SI Appendix, Fig. S2A) in TA lines passaged at 30° and (B) passaged at 37°. Arrowheads indicate de novo T1 insertions, and asterisks indicate the loss of T1 copies relative to the XL280α progenitor genome. (C) T1 mapping using Illumina read-pair analysis. Read depths for T1 in the passaged lines were normalized against the XL280α progenitor genome (Top) to indicate insertion of new T1 copies (peaks) or the loss of T1 copies (troughs) in representative TA lines 37-01, 37-02, and 37-03. The variation in height of each peak or trough corresponds to the number of supporting reads from the read-pair analysis.

