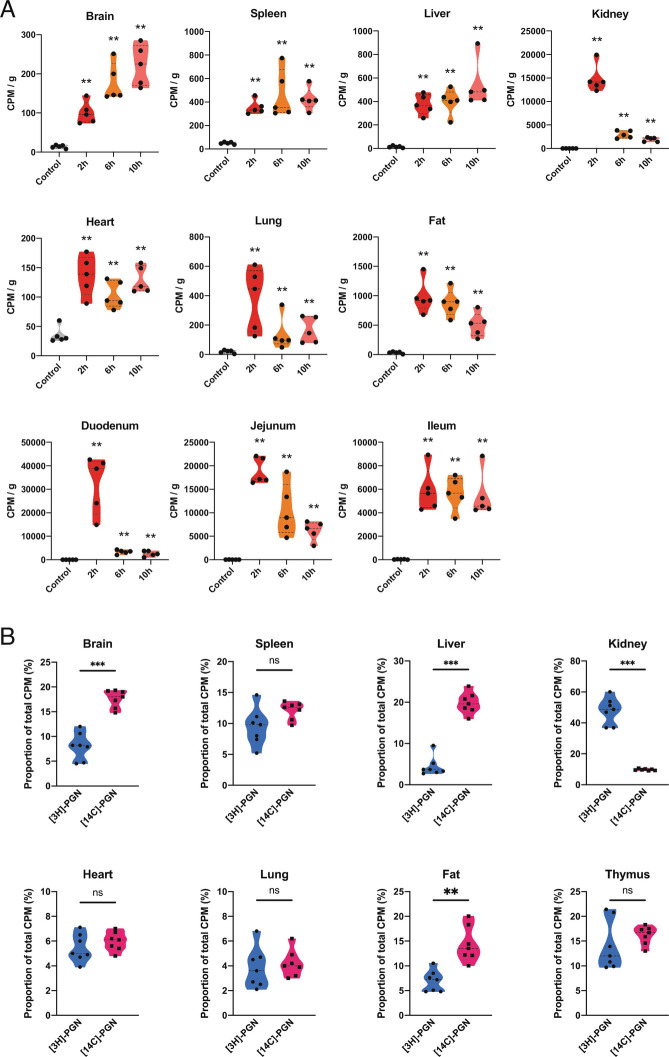
Fig. 3.
Effect of labeling strategy parameters on biodistribution of peptidoglycan. (A) Biodistribution of [3H]-mesoDAP amino acid administered to mice per os. [3H]-mesoDAP biodistribution was measured by scintillation counting of dissolved, decolored organs, 2 h, 6 h, and 10 h postgavage. The measured CPM values are normalized per g tissue weight. (B) Biodistribution of [3H]-PGN versus [14C]-PGN administered to mice by gavage. The relative abundance of [3H]-mesoDAP or [14C]-GlcNAc-labeled peptidoglycan detected for each organ or tissue is shown. Data are presented as the proportion of the sum of all [3H] or [14C] CPM measurements in the organs per mouse. Pairwise comparison with control performed using the Mann–Whitney U test. **P ≤ 0.005; ***P ≤ 0.0005. Welch’s ANOVA comparing time-point groups, excluding control, Brain P = 0.0052; Spleen P = 0.3334; Liver P = 0.3307; Kidney P = 0.0002; Heart P = 0.1921; Lung P = 0.1624; Fat P = 0.0323; Duodenum P = 0.0040; Jejunum P = 0.0003; Ileum P = 0.9333.

