Fig. 2.
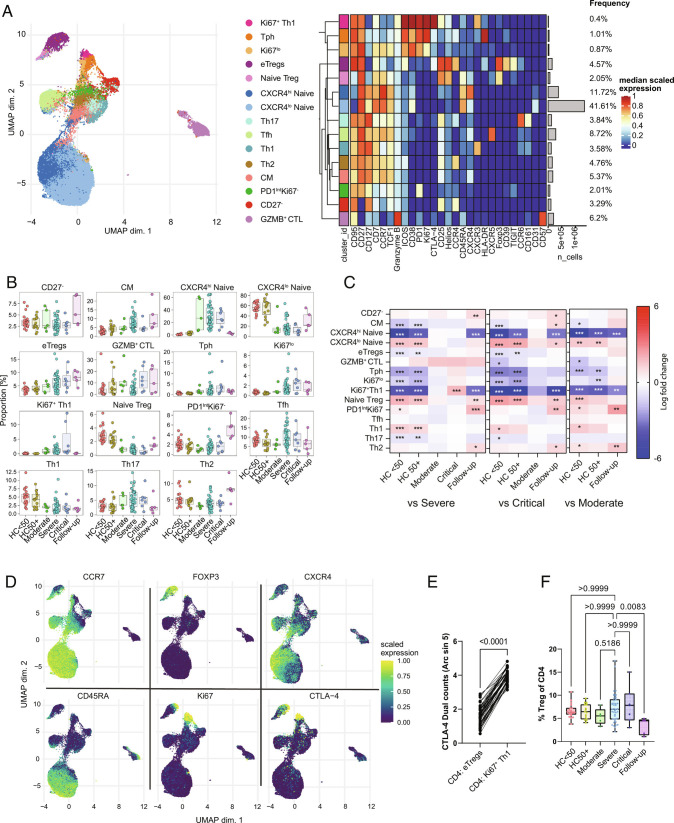
CD4 T cell phenotypes in COVID-19. (A) UMAP and expression heatmap of FlowSOM clusters from CD4 T cells. The heatmap displays scaled expression of indicated markers. (B) Frequency boxplots of proportion within the CD4+ T cell cluster of cells. HCs under 50 y of age (HC < 50), HCs of 50 y of age or above (HC50+), moderate, severe, critical, or follow-up COVID-19 patients. (C) Comparison of the fold change (log2) in cluster frequency between the indicated group and severe (Left), critical (Middle), and moderate (Right) COVID-19 patients. (D) UMAP feature plots of selected markers. (E) Expression of CTLA4 on eTregs vs. Ki67+ Th1 cells. (F) Percentage of Tregs as a proportion of total CD4 T cells. *P ≤ 0.05, **P ≤ 0.01, ***P ≤ 0.001 or value indicated on the graph. Significance by edgeR (C), Wilcoxon matched-pairs (E) or Kruskal–Wallis (F). Effector Treg (eTreg), CM, granzyme B-positive cytotoxic lymphocyte (GZMB+ CTL). Expression values are arcsinh-transformed (cofactor: 5) dual counts.

