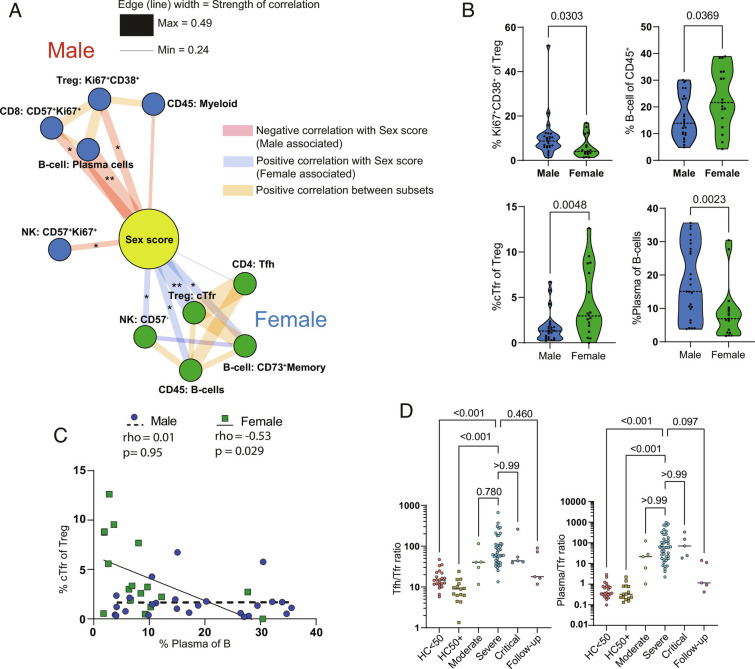
Fig. 5.
Sex correlations with cellular phenotypes in COVID-19. (A) Top 5 cellular correlations with male and female sex in severe COVID-19 patients. Edge width is proportional to correlation strength. Edges connecting to other cellular subsets are positive correlations between indicated subsets. Layout by ForceAtlas2 using edge weights as input. (B) Violin plots of sex-specific differences of indicated cellular populations in severe COVID-19 patients. (C) Correlation of cTfr and plasma cell frequencies in male and female severe COVID-19 patients. (D) Tfh/cTfr ratio and plasma cell/cTfr ratio in indicated patient groups. Correlations in A and C are Spearman’s rank. Significance by Mann–Whitney test (B) or Spearman (C). One female patient with undetectable cTfr was excluded from the ratio analysis. Expression values are arcsinh-transformed (cofactor: 5) dual counts.

