Fig. 8.
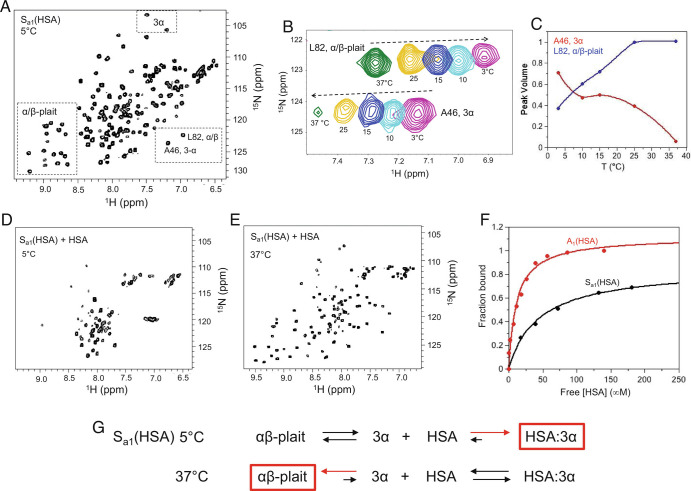
Regulation of fold and HSA-binding function over a narrow temperature range. (A) The 2D 1H-15N HSQC spectrum of Sa1(HSA) at 5 °C. Signature 3α and α/β-plait chemical shifts are boxed. (B) Overlay of the 2D 1H-15N HSQC spectra of Sa1(HSA) from 3 to 37 °C showing residue L82 from the α/β-plait fold and A46 from the 3α state. (C) Normalized peak volume of 3α residue A46 (red) and α/β-plait residue L82 (blue) as a function of temperature. (D) The 2D 1H-15N HSQC spectrum of Sa1(HSA) saturated with four molar equivalents of HSA at 5 °C showing loss of signature 3α and α/β-plait signals. The intense resonances near 8 ppm in the proton dimension correspond with disordered N- and C-terminal regions of the 3α state. (E) The 2D 1H-15N HSQC spectrum of Sa1(HSA) with four molar equivalents of HSA at 37 °C showing α/β-plait signals. (F) HSA-binding curves for A1(HSA) (red) and Sa1(HSA) (black) at 5 °C. The fraction bound is extracted from peak intensity decay of amide proton signals in 2D 1H-15N HSQC spectra of 15N-labeled protein and is plotted against the free HSA concentration. (G) HSA-binding reaction to Sa1(HSA) at 5 °C and 37 °C. The reaction equation at 5 °C is generated based on the absence of α/β-plait resonances at high concentration of HSA. The reaction equation at 37 °C is based on the appearance of α/β-plait signals at high concentration of HSA.

