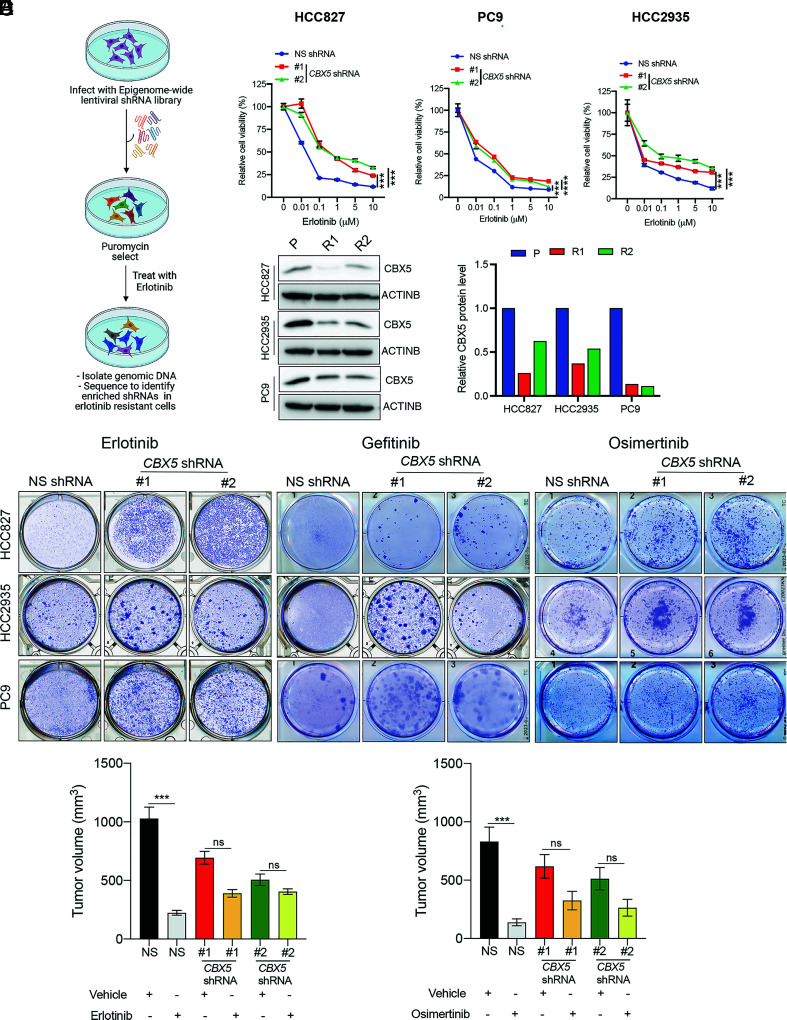
Fig. 1.
A large-scale epigenome-wide human shRNA screen identifies CBX5 as a modifier of EGFRi response. (A) Schematic overview of the large-scale epigenome-wide shRNA screen used to identify epigenetic regulators involved in erlotinib resistance. (B) MTT assay monitoring relative cell viability (%) of HCC827, PC9, and HCC2935 cells expressing an NSshRNA or one of two CBX5 shRNAs and treated for 5 d with the indicated concentrations of erlotinib or dimethyl sulfoxide (DMSO) control (0). (C, Left) Immunoblot analysis measuring CBX5 expression in the indicated EGFRi-sensitive (P) and EGFRi-resistant (R1 or R2) EGFR-mutant LUAD cell lines. ACTINB was used as the loading control. (C, Right) Bar graph showing quantification of the immunoblots. (D) The indicated LUAD cell lines expressing an NS shRNA or CBX5 shRNAs were treated with erlotinib (100 nM), gefitinib (100 nM), osimertinib (20 nM for HCC827; 20 nM for PC9; 100 nM for HCC2935), or DMSO control, for 2 wk, and survival was measured in clonogenic assays. Representative wells for cells grown under the indication conditions are shown. (E) NSG mice (n = 5) were subcutaneously injected with 5 × 10⁶ PC9 cells expressing an NS or CBX5 shRNA and treated with either vehicle (0.5% methylcellulose) or erlotinib (25 mg/kg) 3 d per week until the end of the experiment. Average tumor volumes at the end of the experiment are shown. (F) NSG mice (n = 5) were subcutaneously injected with PC9 cells expressing an NS shRNA or CBX5 shRNA and treated with either vehicle (0.5% carboxy-propyl cellulose and 0.1% Tween 80) or osimertinib (2.5 mg/kg) 3 d per week until the end of the experiment. Average tumor volumes at the end of the experiment are shown. Data are presented as the mean ± SEM. ns = not significant; ***P < 0.001, and ****P < 0.0001.

