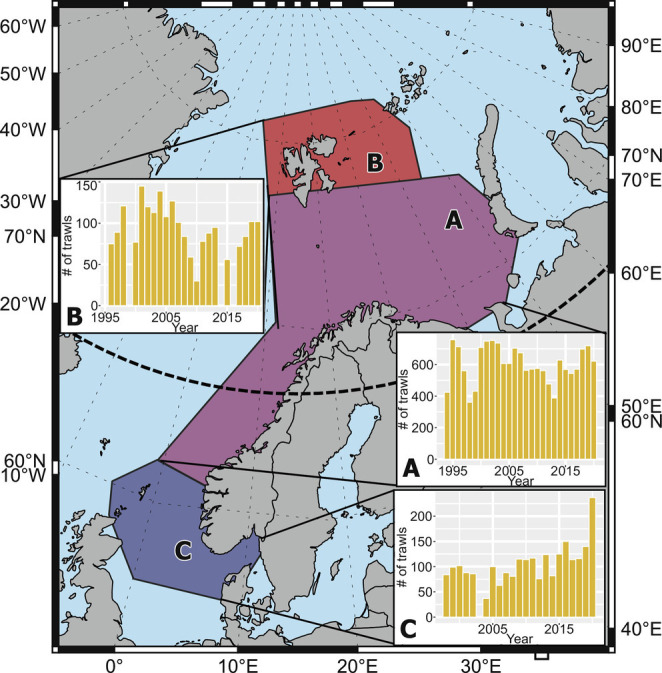
Fig. 1.

Study area and histograms of the temporal distribution of the number of trawls in the present study. A: Norwegian & Barents Sea; B: Svalbard; C: North Sea. Dashed lines are latitude and longitude, and thick black dashed line is the polar circle (66°N).
