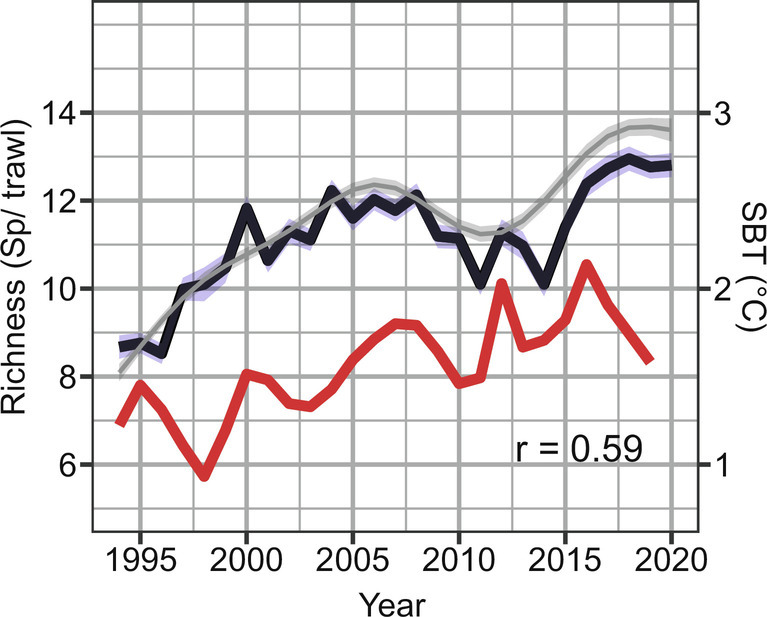
Fig. 2.

Average number of species per trawl (alpha diversity) across the Norwegian-Barents Sea. Black line represents mean species richness per trawl with 95% CI in blue. Grey smoothed line and light grey 95% CI represents the marginal effect of Year for constant sampling effort from a GAM model using Year and swept area as an offset (Table 1). Red line indicates changes in mean sea bottom temperature across the main study area (correlation with mean alpha diversity r = 0.59).
